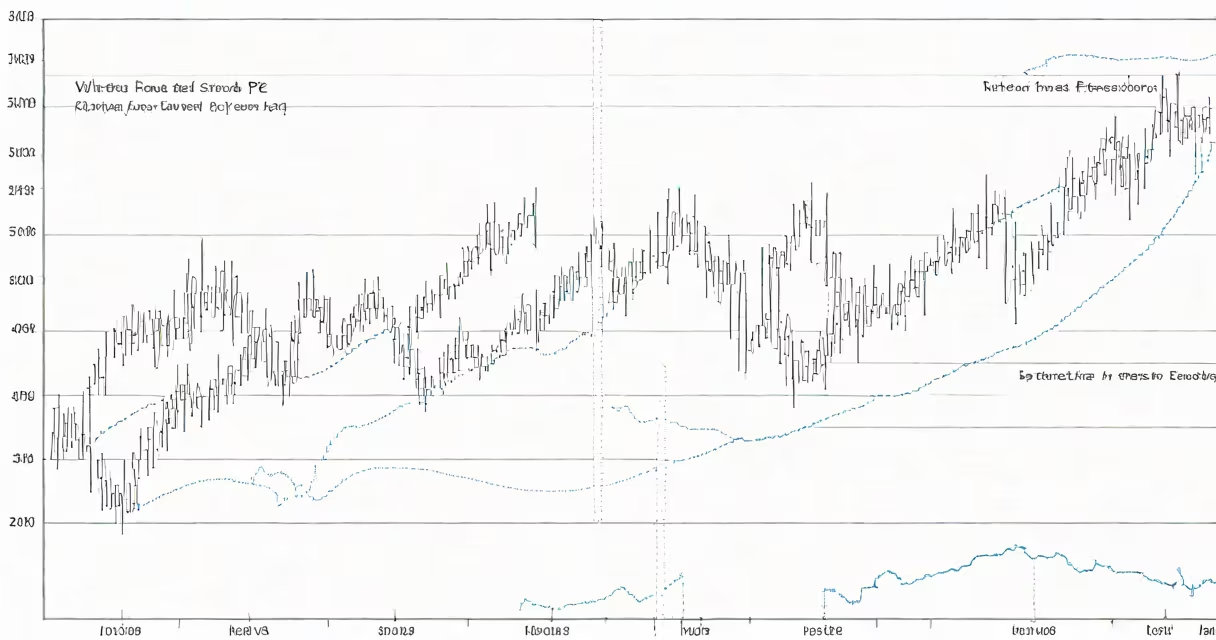
The forward price-to-earnings (forward PE) ratio measures a stock's current price relative to its projected earnings per share over the next 12 months. It reflects investor expectations about a company's future profitability and is used to assess whether a stock is overvalued or undervalued based on upcoming results.
Unlike the trailing PE, which uses actual past earnings, forward PE relies on consensus estimates from financial analysts. A forward PE below 15 often signals potential undervaluation, while a ratio above 25 may suggest high expectations or overvaluation-though context matters. For example, growth stocks in tech or biotech frequently trade at higher forward PEs due to anticipated rapid earnings expansion.
Forward PE is calculated as: Current stock price ÷ Estimated EPS for the next fiscal year. If a stock trades at $100 per share and analysts project $5 in earnings per share next year, the forward PE is 20. This metric is widely used in equity research and portfolio management to compare companies within the same sector.
Forward PE is derived from analyst consensus forecasts, typically gathered through platforms like Refinitiv, Bloomberg, or FactSet. These forecasts are updated quarterly as companies release earnings guidance and new data emerges. The average of multiple analysts' estimates reduces individual bias and provides a more stable projection.
For instance, Apple Inc. (AAPL) traded at $180 per share in early 2024. Analysts forecasted $8.50 in earnings per share for the next fiscal year. Dividing $180 by $8.50 gives a forward PE of approximately 21.2. This figure helps investors gauge whether the market is pricing in optimistic growth or if the stock is fairly valued relative to peers.
Forward PE is especially useful during periods of structural change-like shifts to AI, electric vehicles, or renewable energy-where historical performance doesn't reflect future potential. A company investing heavily in R&D may have low or negative trailing earnings but a positive forward PE based on expected product launches and revenue growth.
While the basic forward PE uses estimated earnings for the next 12 months, variations exist based on time frame and methodology:
| Type | Description | Use Case |
|---|---|---|
| Next 12 Months (NTM) | Most common form; uses projected EPS for the next full fiscal year | Standard comparison across stocks |
| Forward PE Based on Fiscal Quarter Estimates | Uses earnings projections for the next four quarters, even if they span two fiscal years | Useful for companies with uneven seasonal cycles |
| Normalized Forward PE | Adjusts for cyclical factors, such as inflation or interest rate swings | More accurate for commodities or industrials |
Some analysts apply smoothing techniques to eliminate outliers in forecast data. For example, if 10 analysts predict EPS between $3.00 and $6.00, a median estimate may be used instead of the mean to avoid distortion from extreme values. This normalization improves reliability in sectors with volatile outlooks.
Forward PE is not a guarantee of future performance. It assumes that analysts' forecasts are accurate and that the company meets its guidance. In reality, earnings can fall short due to supply chain disruptions, regulatory changes, or competitive pressure. A forward PE of 15 doesn't ensure a stock will rise-it only suggests the market prices the stock at 15 times expected earnings.
A frequent error is comparing forward PE across industries without adjusting for growth rates. A forward PE of 30 in a semiconductor firm may be reasonable if earnings are expected to double in two years. But the same ratio in a utility company with flat growth could signal overvaluation. Always compare forward PE within peer groups.
Another mistake is relying solely on forward PE without considering cash flow, debt levels, or free cash flow yield. A company with a low forward PE but rising debt and declining cash flow may still be risky. According to the CFA Institute, forward PE should be used alongside other metrics like price-to-sales or enterprise value-to-EBITDA for a complete picture.
In Q1 2024, Qualcomm (QCOM) traded at $112 per share. Analysts projected $4.80 in earnings per share for the fiscal year ending September 2024. The forward PE was $112 ÷ $4.80 = 23.3. This compares to a trailing PE of 18.7, indicating the market expects stronger earnings growth.
Qualcomm's forward PE is elevated compared to the S&P 500 average of ~16.5, but justified by its leadership in 5G chipsets and expanding presence in automotive semiconductors. The company reported 22% year-over-year revenue growth in its last quarter, supporting upward revisions in EPS forecasts. Investors using forward PE here see value in long-term momentum rather than short-term results.
Trailing PE uses actual earnings from the past 12 months. Forward PE uses projected earnings. The difference lies in timing and intent: trailing PE shows what happened; forward PE shows what's expected.
Consider a company with $1 in trailing EPS and $1.20 in forward EPS. If the stock trades at $24, the trailing PE is 24, and the forward PE is 20. The drop in PE suggests improving value as future earnings rise. However, if the stock price falls to $20 while forward EPS stays at $1.20, the forward PE drops to 16.7-a sign of improved affordability.
Forward PE is more sensitive to news and guidance. A single analyst upgrade can push the forward PE up. Conversely, a downgrade can cause a sharp decline. Trailing PE changes only when actual earnings are reported.
I once evaluated a small-cap biotech firm with a forward PE of 40 based on a promising drug trial. The stock rose 30% on the announcement. But when the FDA rejected the drug application six months later, earnings collapsed. The forward PE became meaningless overnight. The lesson: forward PE is a snapshot of expectation, not certainty.
Forward PE is most effective when combined with qualitative analysis-management quality, competitive moat, capital allocation. As Morningstar notes, "Forward PE is a tool, not a rule. It informs, but doesn't replace judgment."
Understanding what forward PE means requires recognizing its role in forecasting. It's not a standalone signal. This guide explains the full context behind forward PE, including how to interpret it across different market environments.
Forward PE is a critical component of modern stock analysis. It shifts focus from history to future potential, helping investors identify opportunities in high-growth sectors. Used wisely, it offers insight into market sentiment and long-term value.