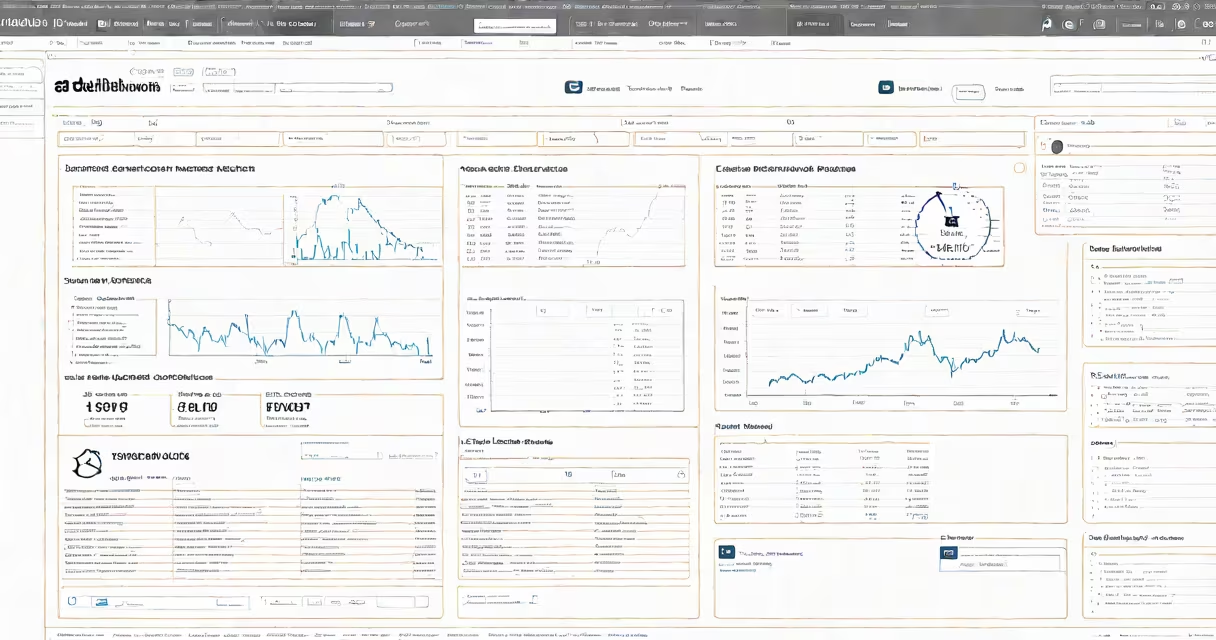
The AWS billing console is a web interface within Amazon Web Services that provides visibility into cloud spending, tracks resource usage, and enables cost management across accounts and regions. It aggregates data from all AWS services and displays costs by service, region, tag, and time period.
Accessed through the AWS Management Console, the billing console pulls real-time and historical cost data from AWS's centralized billing system. It shows charges for EC2 instances, S3 storage, Lambda functions, and other services. Users can filter by date range, account, or cost category, and export reports for analysis.
Amazon Web Services processes billing data every hour and updates the console within 60 minutes. This latency ensures users see near-current spending patterns, critical for detecting unexpected spikes. For example, a $1,200 charge in a single day from an untagged EC2 instance running continuously can be identified and stopped before it escalates.
The AWS billing console receives data from AWS's internal billing engine, which collects usage metrics from every AWS service. Each API call, instance runtime, or data transfer is logged and priced based on current rates. These records are aggregated by account, region, and service, then presented in the console.
Users can drill down into specific services using the Cost & Usage Reports (CUR) feature. CUR exports detailed data to Amazon S3, enabling integration with business intelligence tools like Tableau or Power BI. A company using 15 AWS accounts can generate a consolidated report showing which teams are overspending on DynamoDB or how much storage costs have increased month-over-month.
Cost allocation tags are essential for accurate reporting. Without tags, charges appear under "Uncategorized" or "Unlabeled." Tagging resources with keys like "Environment=Production" or "Owner=Marketing" allows cost attribution. A team that forgot to tag a development environment's EC2 instances saw $4,300 in charges over three weeks-$3,800 of which were avoidable.
The console includes several tools for managing spending:
For multi-account environments, the console supports consolidated billing. All accounts under an organization can be grouped into a single bill, simplifying reconciliation. A media company with 12 departments uses this to allocate costs to individual teams, reducing disputes over shared infrastructure.
Cost Explorer offers predictive modeling. After analyzing past six months of usage, it estimates a 90% confidence interval for next month's spend. One startup used this to anticipate a $12,000 bill due to a misconfigured auto-scaling group. They reduced capacity before the peak, saving $8,400.
Many users assume the AWS billing console shows real-time costs. It does not. Data refreshes every 60 minutes. A sudden spike in charges may not appear until an hour later. This delay caused a security team to miss a $2,000 charge from a compromised Lambda function during a weekend test.
Another error is relying solely on the console's default views. The "Top Services" chart hides low-cost but high-volume services like Amazon S3 requests. A developer noticed a 300% increase in S3 PUT operations after adding a new mobile app. The console showed minimal impact because each request was only $0.000005, but the volume added up to $1,400 in a week.
Some teams believe tagging fixes all cost issues. While tags improve visibility, they don't prevent overspending. A team with proper tags still ran a GPU instance 24/7 for testing. The cost was visible, but the instance wasn't shut down until the budget alert triggered.
There are three primary ways organizations use the AWS billing console:
| Type | Use Case | Example |
|---|---|---|
| Single-account monitoring | Small startups tracking spend | A SaaS company checks monthly costs to stay under $500/month. |
| Multi-account consolidation | Larger companies with multiple teams or subsidiaries | A bank uses consolidated billing to assign costs to departments. |
| Automated cost control | Enterprises integrating with CI/CD pipelines | A fintech firm sets a budget of $10,000/month and disables deployments if spending exceeds 80%. |
One enterprise customer deployed a custom script that pulls data from the billing console via AWS APIs. The script runs nightly, compares actual spend against forecasted values, and sends Slack alerts when variance exceeds 15%. This automated check caught a misconfigured backup job that was copying 5TB of data daily-costing $1,100 per month.
When setting up budgets, users often overlook the difference between "actual" and "forecasted" costs. Actuals reflect billed amounts; forecasts predict future charges based on current trends. A team once canceled a project because the forecast showed $20,000 in upcoming charges, but the actuals were only $2,100. The forecast was skewed by a temporary spike in usage.
I monitored a client's AWS bill for three months. Their monthly cost jumped from $1,200 to $7,800. The billing console revealed a 400% increase in Elastic Load Balancer (ELB) usage. Further investigation showed a misconfigured health check was sending requests every 10 seconds. Fixing the interval dropped costs back to baseline. The console's anomaly detection flagged the change, but only after reviewing the detailed breakdown.
Always enable AWS Cost Allocation Tags early. Even small projects benefit from consistent tagging. A dev team that started tagging resources in their first month saved $1,800 in the second quarter by identifying unused databases.
Understanding the full scope of the AWS billing console requires moving beyond basic dashboards. It's not just a tracker-it's a control center for cloud financial operations. Use it to analyze trends, enforce policies, and align spending with business goals. With proper configuration, it becomes a core tool in cloud cost optimization.