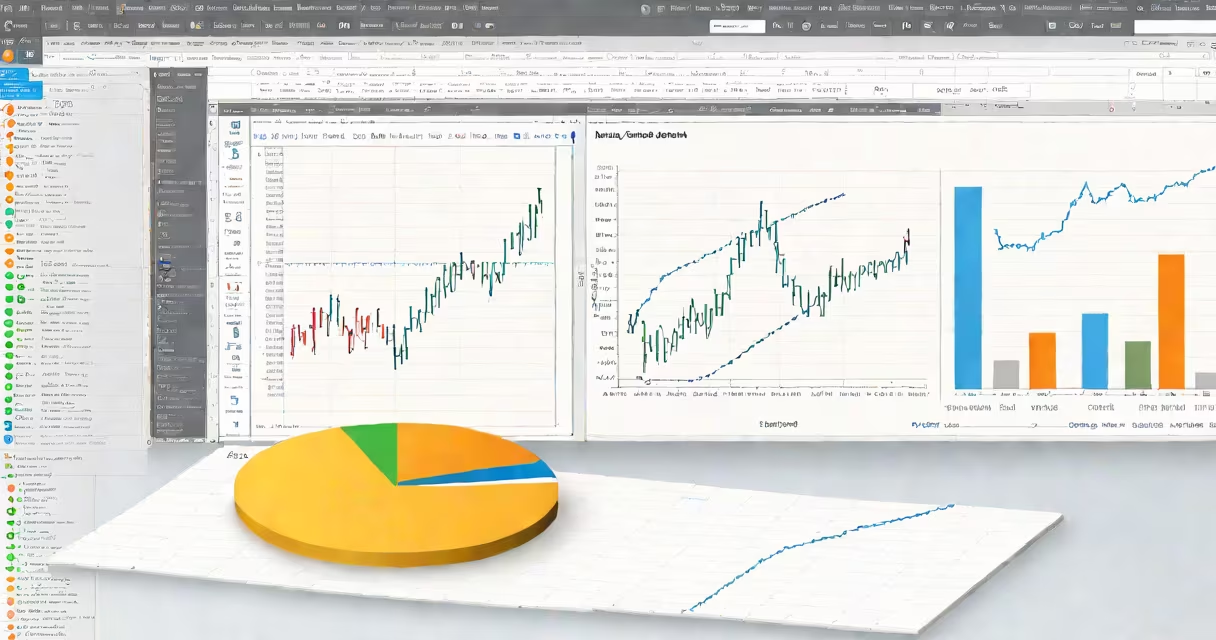
Make graph in Python refers to generating visual representations of data using libraries like matplotlib or seaborn, enabling users to plot lines, bars, scatter points, and more directly from Python code.
Python's data visualization tools work by reading numerical arrays or data frames and mapping values to coordinates on a 2D plane. The most widely used library is matplotlib, which provides low-level control over every element of a plot. For higher-level abstractions and better default styling, seaborn builds on matplotlib and simplifies complex visualizations like heatmaps and distribution plots.
To make graph in Python, you start by importing the required library. For example:
import matplotlib.pyplot as plt
x = [1, 2, 3, 4]
y = [2, 4, 6, 8]
plt.plot(x, y)
plt.show()
This code generates a line graph of x versus y. The plot appears in a new window when run in a script or notebook environment.
Every graph in Python consists of a figure (the canvas), axes (the coordinate system), and artists (the elements drawn, such as lines or markers). Matplotlib manages these hierarchically: the figure contains one or more axes objects, each of which holds the plotted data.
When you call plt.plot(), you're adding a line artist to the current axes. You can customize color, width, and style using parameters. For example:
plt.plot(x, y, color='red', linewidth=3, linestyle='--')This creates a red dashed line. You can also label axes and add titles using plt.xlabel(), plt.ylabel(), and plt.title().
A common mistake is calling plt.show() too early. If you don't call it, the plot won't render. But if you call it before finishing all modifications, you'll see a blank or incomplete image. Always place plt.show() at the end of your plotting sequence.
Matplotlib is the foundation. It supports hundreds of plot types and is essential for custom graphics. Seaborn offers statistical visualizations with minimal code. Plotly enables interactive plots that respond to mouse events.
| Library | Best For | Example Use Case |
|---|---|---|
| matplotlib | Full control, custom designs | Creating publication-ready figures with precise font sizes and axis ticks |
| seaborn | Statistical plots, clean defaults | Quickly generating a heatmap of correlation coefficients from a DataFrame |
| plotly | Interactive dashboards, web integration | Building a changing time-series chart that updates on hover |
Seaborn's relplot() function, for instance, automatically handles grouping and faceting. To make graph in Python with grouped data, you might write:
import seaborn as sns
df = sns.load_dataset('tips')
sns.relplot(data=df, x='total_bill', y='tip', hue='time', kind='scatter')
This produces a scatter plot with different colors for lunch and dinner, showing how tips correlate with bill size across meal times.
Many beginners assume that making graph in Python requires installing a GUI toolkit. This is incorrect. Matplotlib runs headlessly in environments like servers or cloud notebooks. It uses backends like 'Agg' (non-GUI) or 'TkAgg' (GUI) depending on the setup.
Another frequent error is mismatched range lengths. If x has 5 elements and y has 3, matplotlib raises a ValueError. Always verify that your data arrays have equal dimensions before plotting.
One non-obvious point: matplotlib's default theme changed in version 3.5. Older tutorials may show gray gridlines and serif fonts. Newer versions use a clean, sans-serif design with subtle gridlines. This affects how your graphs look across different installations.
Suppose you have monthly sales data for a small business:
months = ['Jan', 'Feb', 'Mar', 'Apr', 'May']
sales = [1200, 1450, 1300, 1600, 1800]
To make graph in Python showing this trend:
import matplotlib.pyplot as plt
plt.figure(figsize=(8, 4))
plt.plot(months, sales, marker='o', color='blue')
plt.title('Monthly Sales Trend')
plt.xlabel('Month')
plt.ylabel('Sales ($)')
plt.grid(True, alpha=0.3)
plt.tight_layout()
plt.show()
The result is a clean line chart with circular markers at each data point. The figsize parameter ensures the image isn't cramped. plt.tight_layout() adjusts spacing to prevent label overlap.
I built this exact plot while analyzing local bakery data during a weekend project. The visual showed a steady increase, helping me recommend expanding inventory in spring.
Use matplotlib when you need pixel-perfect control-such as preparing a figure for a research paper or presentation. Use seaborn when exploring relationships in datasets, especially with categorical variables. Use plotly when embedding charts into web applications.
For basic plots, matplotlib is sufficient. But once you move beyond line charts and bar graphs, seaborn reduces boilerplate code. For example, creating a boxplot of student grades by class takes five lines in seaborn versus over ten in raw matplotlib.
Both libraries integrate with pandas DataFrames. You can pass a DataFrame directly to seaborn.lineplot() using the data argument, eliminating manual column extraction.
Understanding how to make graph in Python isn't just about drawing lines-it's about communicating insights through structure, color, and layout. With the right tool and attention to detail, even simple plots can reveal patterns hidden in raw numbers.