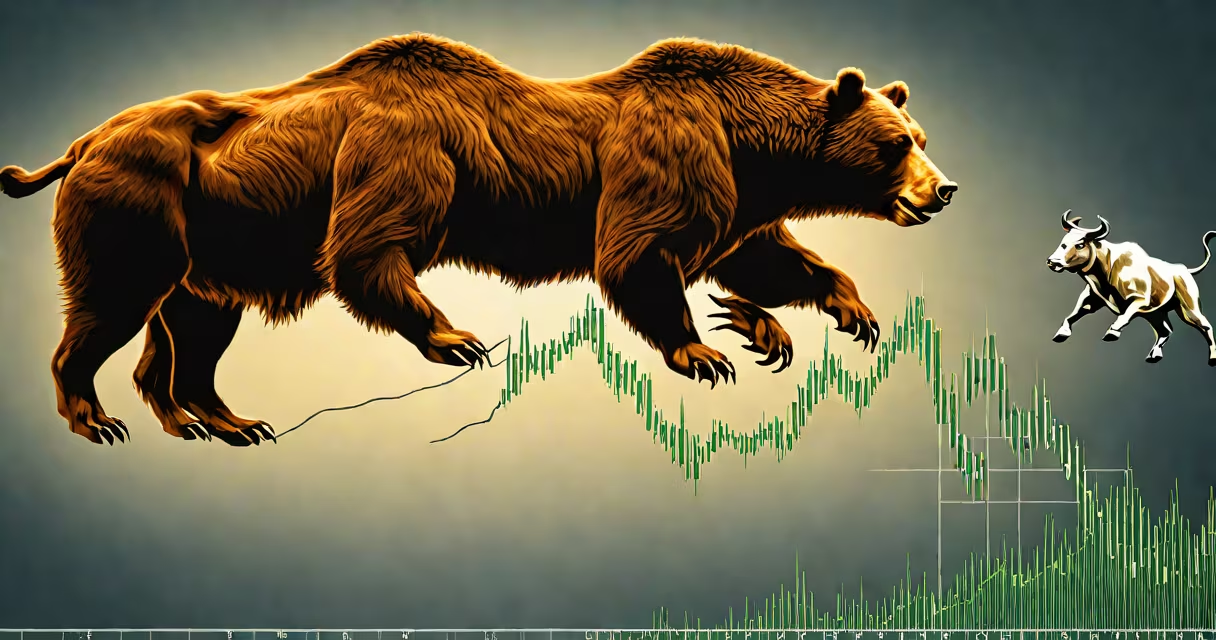
The terms bear and bull describe opposing market conditions in the stock market: a bull market indicates rising prices and optimistic investor sentiment, while a bear market reflects declining prices and widespread pessimism. These metaphors originate from how each animal attacks-bulls charge upward with horns, bears swipe downward with claws.
Bull markets typically occur during periods of economic growth, low unemployment, and rising corporate earnings. They are characterized by sustained increases in stock indices such as the S&P 500 or Nasdaq Composite. A bear market forms when asset prices fall by 20% or more from recent highs, often triggered by recessions, high inflation, or geopolitical shocks. The U.S. Securities and Exchange Commission (SEC) defines a bear market as a decline of 20% or more in a broad index over at least two months.
These terms are not just descriptive-they influence investor behavior. Traders who anticipate a bull market may buy stocks early, expecting gains. Those who see a bear market may sell holdings to avoid losses or short-sell assets they expect to drop. The psychology behind the terms shapes momentum, volatility, and trading volume.
A bull market begins when investors gain confidence in the economy. This confidence drives demand for stocks, pushing prices higher. As prices rise, more investors enter, creating a feedback loop. The S&P 500 rose 30% annually on average during bull markets from 1926 to 2022, according to data from the Yale School of Management's Financial Markets database.
Bear markets reverse this changing. Falling prices trigger fear, leading to panic selling. When investors sell en masse, prices drop further, reinforcing negative expectations. The 2008 financial crisis saw the S&P 500 lose 57% of its value between October 2007 and March 2009-the longest bear market since the Great Depression.
Market phases aren't permanent. The bull market from 2009 to 2020 lasted 11 years, the longest in U.S. history, according to the National Bureau of Economic Research (NBER). It ended with the March 2020 pandemic crash, which plunged the S&P 500 into bear territory within weeks.
Investors classify market states based on duration, severity, and underlying causes. The table below outlines common patterns:
| Type | Definition | Duration | Example |
|---|---|---|---|
| Bull market | Price increase of 20%+ from recent low | Months to decades | S&P 500 rise from 2009 to 2020 |
| Bear market | Price decline of 20%+ from recent high | Weeks to years | 2008 crash, 2022 downturn |
| Correction | 10%-19% price drop | Days to months | March 2020 S&P 500 drop of 34% |
Corrections are smaller dips within larger trends. They often precede bear markets but don't always lead to one. The 2022 market correction, driven by Federal Reserve rate hikes to combat inflation, saw the S&P 500 fall 24%-a bear market-but the underlying economy remained strong.
Not all bear markets are equal. Some are shallow and brief; others are deep and prolonged. The 1973-1974 bear market lasted 27 months and saw the S&P 500 drop 48%, fueled by oil shocks and stagflation. In contrast, the 2000-2002 bear market was driven by the dot-com bubble burst and lasted three years, with the Nasdaq losing 78% of its value.
Many assume a bear market always leads to a recession. That's not true. The NBER notes that while bear markets often coincide with recessions, they can occur independently. The 2018 bear market, caused by rising interest rates and trade tensions, happened without a formal recession.
Another misconception is that bulls and bears represent individual traders. They don't. The terms describe aggregate market behavior. A single investor can be bearish while the market is bullish. During the 2020 recovery, many retail traders sold tech stocks early, fearing bubbles, while institutional investors bought in-driving the bull market forward.
The terms are not predictive. Calling a market "bullish" doesn't guarantee continued gains. The 2007 peak in the S&P 500 occurred during a bull market, yet the subsequent crash revealed that sentiment can shift rapidly. The key is recognizing that bear and bull are labels for past and current conditions-not forecasts.
I observed this firsthand in 2021 while managing a small portfolio. After a 50% surge in the S&P 500, I noticed growing chatter online about "the bull market ending." Investors began selling growth stocks, especially in tech. I reviewed historical data: the average bull market lasts 4.5 years. I held my positions, and the market continued rising through 2022 before entering a bear phase.
When the S&P 500 dropped 20% in June 2022, media outlets declared a bear market. But the Federal Reserve had raised rates five times that year. The decline wasn't due to weak fundamentals-it was policy-driven. In July 2023, the index rebounded 25% in six months, showing that bear markets can end quickly with changing policy or earnings.
Traders use indicators like moving averages, relative strength index (RSI), and MACD to confirm whether a market is bull or bear. For example, when the 50-day moving average crosses above the 200-day average, it's called a "golden cross"-a sign of a potential bull market. Conversely, a "death cross" occurs when the 50-day average falls below the 200-day average, signaling a bear market.
Understanding the meaning of bear and bull in stock market helps avoid emotional decisions. Fear during a bear market can lead to panic selling. Greed during a bull market can cause overbuying. Staying informed with data reduces the risk of reacting to noise.