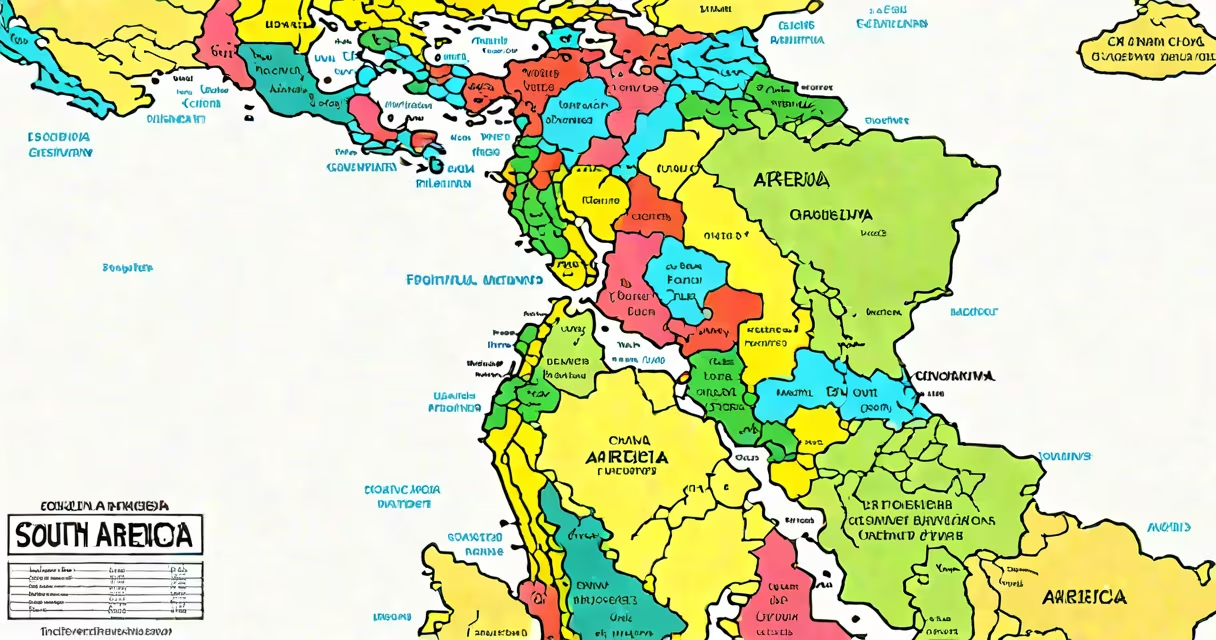
A political map of South America displays the recognized sovereign states, their borders, capital cities, and administrative divisions as defined by international law and diplomatic recognition. It reflects political sovereignty, not physical geography.
These maps show where governments control territory, not natural features like rivers or mountain ranges. They are used in education, diplomacy, journalism, and military planning to represent state authority. Unlike physical maps, which show elevation and terrain, political maps focus on human-made divisions.
The current political map of South America consists of 12 independent nations, each with internationally recognized borders. These borders were shaped by colonial rule, independence movements, treaties, and conflicts. For example, the boundary between Brazil and Bolivia was established through the Treaty of Petrópolis in 1903, following the War of the Triple Alliance.
Political maps use color coding, labeled borders, and symbols to identify countries, capitals, and sometimes provinces or territories. Lines between countries are drawn based on agreements, not natural features. A single border may cross deserts, mountains, or forests, reflecting historical negotiation rather than geography.
Capitals are marked with icons or text. For example, Lima is the capital of Peru, located on the Pacific coast. Brasília, the capital of Brazil, sits inland at high altitude-a deliberate choice made in 1960 to promote national unity and development.
Maps often include scale bars and legends. The legend explains what colors mean-blue for ocean, green for land, red for capital cities. Scale ensures measurements are accurate. A 1 cm line might represent 100 km in reality.
There are several standard types of political maps:
| Type | Focus | Use Case |
|---|---|---|
| World-scale | Entire continent or globe | Global education, news reporting |
| Regional | South America or Latin America | Classroom instruction, travel guides |
| National | Single country, e.g., Argentina | Internal planning, election mapping |
| Administrative | Provinces, departments, states | Governance, census data |
Some maps include additional layers-like population density or economic zones-but pure political maps stick to jurisdictional lines. The United Nations uses standardized political maps for membership records and peacekeeping operations.
For example, the UN's official map of South America includes the Falkland Islands (Malvinas) under British administration, while Argentina claims them. This reflects ongoing sovereignty disputes, not geographic error.
People often confuse political maps with physical or thematic maps. A physical map shows elevation, rivers, and vegetation. A thematic map might display GDP per capita or literacy rates. Mixing them leads to errors-such as assuming a country with high rainfall is wealthy, which isn't always true.
Another misconception is that borders are permanent. In reality, they change. The border between Colombia and Venezuela shifted after the 1941 treaty. The 1994 agreement between Ecuador and Peru ended decades of conflict over the Cenepa Valley, adjusting the frontier by nearly 100 km.
Even within a country, boundaries can shift. In 2008, Bolivia created the department of Santa Cruz de la Sierra, altering internal governance. These changes don't appear on outdated maps.
During the 2023 South American Games in Santiago, Chile, organizers used a political map to assign athlete delegations to zones. The map showed all 12 nations, with Chile highlighted as host. This helped logistics teams manage transportation and security.
In classrooms, teachers use political maps to explain how Spanish and Portuguese colonization led to linguistic divides. Countries like Paraguay and Uruguay share borders but speak different languages-Guaraní and Portuguese respectively-due to colonial history.
I once used a political map of South America during a field study in the Amazon Basin. We needed to verify which country controlled a specific river tributary. The map confirmed that the Rio Negro flows through Brazil and Colombia, but its mouth lies in Brazil. That detail mattered for environmental monitoring.
Incorrect political maps can fuel misinformation. In 2020, a viral image showed Venezuela extending into the Atlantic Ocean. It was a mislabeled map-Venezuela's coastline ends at the Gulf of Venezuela. Such errors distort public understanding of global affairs.
Authoritative sources like the CIA World Factbook and the U.S. State Department's Bureau of Intelligence and Research provide vetted political maps. The CIA's map of South America includes disputed areas like the Beagle Channel, annotated with notes on sovereignty claims.
According to the National Geographic Society, political maps must be updated every five years to reflect new borders. Since 2000, four new territorial adjustments have occurred in South America due to arbitration or referendums.
The political map of South America is not static. It evolves with diplomacy, war, and decolonization. Understanding it requires knowing both current borders and the history behind them. Always consult recent, authoritative sources when using such maps for research or decision-making.