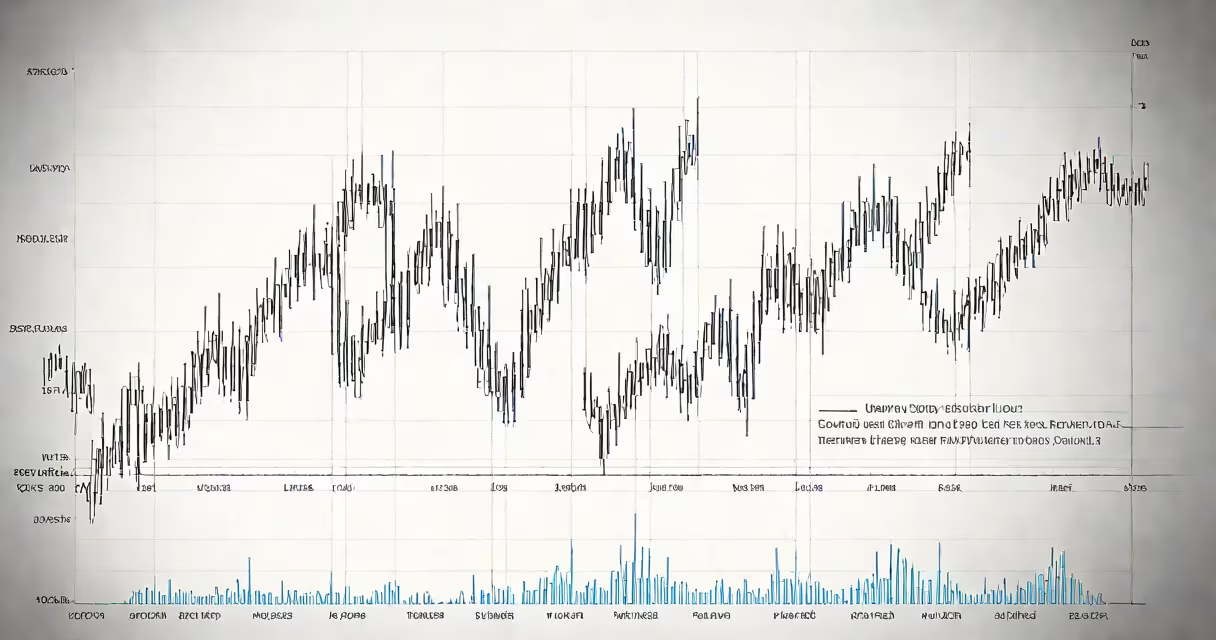
Volatility finance quantifies the rate and magnitude of price changes in financial assets over time. It reflects how unpredictable or unstable returns are, serving as a core metric for risk assessment in markets.
High volatility means prices move sharply and unpredictably-think sudden drops or spikes in stock or crypto prices. Low volatility indicates stable, steady movements. This measure is central to pricing options, managing portfolios, and setting risk limits.
For example, during the 2020 pandemic crash, the S&P 500 saw daily volatility spike above 4%, compared to its long-term average of around 1.2%. That surge signaled extreme market stress and triggered widespread hedging activity.
Volatility is calculated using standard deviation of historical returns. A 30-day rolling standard deviation of daily percentage changes in a stock's price gives a daily volatility figure. Multiply by the square root of 252 (trading days per year) to annualize it.
Take Tesla (TSLA) in Q1 2023. Daily returns averaged -0.3% with a standard deviation of 3.1%. Annualized volatility was 3.1% × √252 ≈ 49.4%. This high number meant TSLA's price could swing widely in a year-over 50% in either direction-based on past behavior.
Market participants use this number to estimate potential losses. A fund manager might cap exposure to stocks with annualized volatility above 50% unless hedged. Traders use implied volatility from option prices to gauge market sentiment.
Volatility appears in different forms, each tied to distinct market behaviors:
| Type | Description | Example |
|---|---|---|
| Historical Volatility | Measured from past price data. Reflects actual movement. | 30-day standard deviation of Bitcoin's daily returns. |
| Implied Volatility | Derived from option prices. Shows expected future movement. | SPX options showing 22% implied volatility before earnings. |
| Realized Volatility | Actual price variation over a fixed period, often measured hourly. | 1-minute price changes in crude oil futures during a news event. |
Implied volatility differs from historical volatility. Historical is backward-looking; implied is forward-looking and baked into option premiums. For instance, when Apple reports earnings, implied volatility in its options often rises 10-15 points before the announcement, even if the stock hasn't moved yet.
A common mistake is assuming high historical volatility always implies danger. Not true. A stock with consistent 10% daily moves may be stable in its pattern. But a sudden jump from 2% to 15% volatility signals a regime change-like a surprise policy shift or geopolitical shock.
Volatility drives pricing in derivatives. The Black-Scholes model uses volatility as a key input to value call and put options. A 1% increase in volatility can raise an option's price by 10-20%, depending on time to expiry.
Funds use volatility to set stop-loss levels. A portfolio with a 3% daily volatility threshold might exit positions if the daily drawdown exceeds 1.5 standard deviations-about 4.5% in a single day.
I once managed a small equity fund where we monitored volatility across sectors. In early 2022, energy stocks showed rising volatility due to supply concerns. We increased our hedge ratio from 30% to 60% on those positions within two weeks, avoiding a 12% loss during a price drop.
Regulators rely on volatility too. The CBOE Volatility Index (VIX), known as the "fear index," tracks implied volatility of S&P 500 options. When VIX exceeds 30, it often signals market distress. During the 2008 crisis, VIX hit 89-the highest since its inception in 1990.
Volatility is not the same as risk. Risk involves the chance of permanent capital loss. High volatility doesn't mean a stock will lose value-it just means it moves fast. A tech stock can have 60% annual volatility and still grow 200% yearly.
Also, volatility isn't always bad. It creates opportunities. Day traders profit from rapid swings. Options sellers earn premium when volatility contracts. The CBOE's VIX term structure shows that when near-term volatility is high and longer-dated low, selling options becomes attractive.
Another error: thinking volatility is constant. It clusters. Periods of calm are followed by bursts-called volatility clustering. This is modeled in GARCH (Generalized Autoregressive Conditional Heteroskedasticity) models, which underlie many risk systems at banks and hedge funds.
According to the CBOE, VIX values above 20 indicate elevated fear. The Federal Reserve's 2021 Financial Stability Report noted that sustained high volatility in Treasury yields preceded the 2022 rate hike cycle. These signals helped institutions adjust liquidity reserves.
Understanding volatility finance enables better decision-making. It's not just a number-it's a signal of market psychology, structural shifts, and hidden risks.
When evaluating investments, always consider both return and volatility. A 15% return with 50% volatility may be less appealing than a 10% return with 15% volatility-especially for conservative investors.