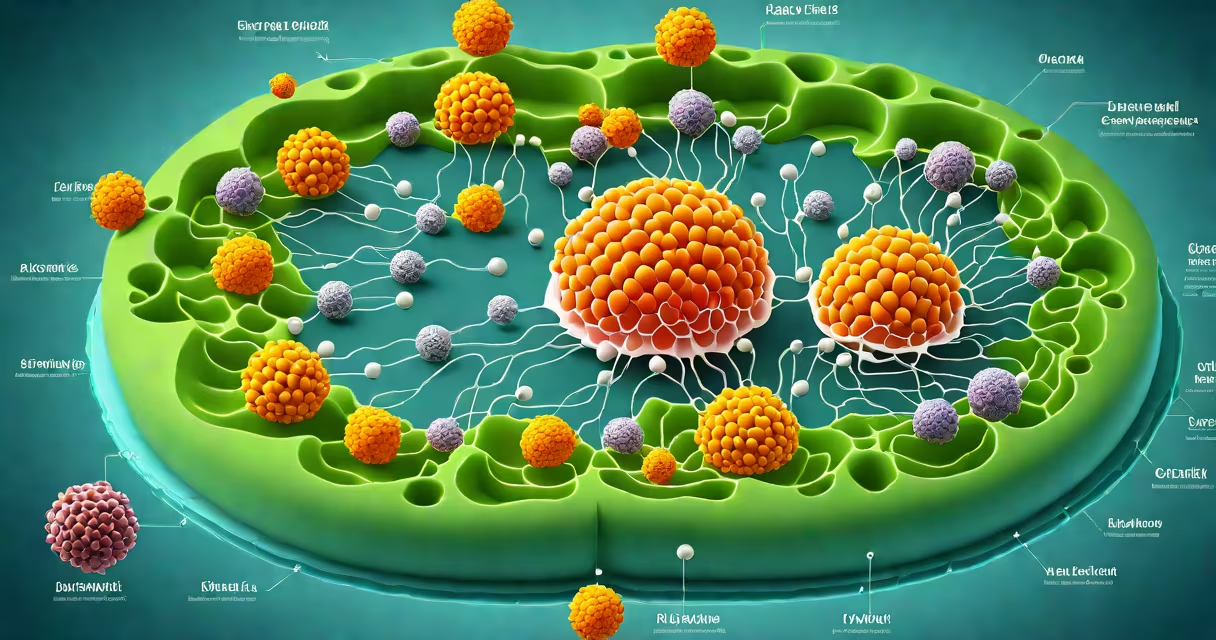
A diagram of a cell is a visual representation showing the structural components and spatial organization of cellular parts, including organelles, membranes, and internal compartments. It illustrates both eukaryotic and prokaryotic cell types, highlighting differences in complexity and function.
These diagrams serve as educational tools to show how cells maintain life processes such as energy production, protein synthesis, and waste removal. They are used in biology classrooms, textbooks, and research publications to clarify complex internal systems.
Cell diagrams typically label key structures like the nucleus, mitochondria, ribosomes, endoplasmic reticulum, Golgi apparatus, lysosomes, cytoskeleton, and plasma membrane. Accuracy depends on the cell type being depicted-animal, plant, fungal, or bacterial.
Each component in a diagram of a cell corresponds to a physical structure with a specific biological role. The layout reflects actual cellular architecture, often drawn in cross-section to show internal organization.
For example, the nucleus appears centrally in eukaryotic cells, enclosed by a double membrane called the nuclear envelope. This compartment houses DNA and controls gene expression. The mitochondria, shown as bean-shaped organelles with folded inner membranes, represent sites of aerobic respiration and ATP generation.
Prokaryotic cells lack membrane-bound organelles. A diagram of a bacterial cell places the nucleoid-a dense region of DNA-near the center, surrounded by cytoplasm. Ribosomes appear scattered throughout, and the cell wall is thick and rigid, distinguishing it from animal cells.
Diagrams differ based on cell type, scale, and purpose. The most common categories are eukaryotic, prokaryotic, and specialized diagrams for specific tissues or functions.
| Type | Key Features | Common Use |
|---|---|---|
| Eukaryotic | Nucleus, mitochondria, ER, Golgi, lysosomes, cytoskeleton | Human, animal, plant, fungal cells |
| Prokaryotic | No nucleus, nucleoid, circular DNA, flagella, thick cell wall | Bacteria, archaea |
| Specialized | Highlighted organelles related to function (e.g., cilia in respiratory cells) | Medical education, tissue-specific studies |
Plant cell diagrams include chloroplasts and a large central vacuole absent in animal cells. The cell wall, made of cellulose, appears as a rigid outer layer. These features reflect adaptations to photosynthesis and structural support.
Some diagrams emphasize metabolic pathways. For instance, a mitochondrial diagram may show the Krebs cycle and electron transport chain locations within the inner membrane folds (cristae).
Diagrams of a cell are standard in secondary and university biology curricula. They help students visualize abstract concepts like diffusion, osmosis, and protein trafficking.
In medical contexts, a diagram of a cell aids in diagnosing diseases. For example, abnormal mitochondria in a diagram can signal mitochondrial disorders like Leigh syndrome, which affect energy metabolism.
Research labs use detailed diagrams to plan experiments. A scientist studying autophagy might reference a diagram showing lysosome fusion with vesicles to model degradation processes.
One non-obvious fact: many textbook diagrams simplify reality. Organelles are often shown as clean, isolated shapes, but in living cells, they exist in changing networks. The endoplasmic reticulum forms continuous membranes with the nuclear envelope, and mitochondria constantly fuse and divide.
Many assume all cells have a nucleus. A diagram of a cell must distinguish between eukaryotes (nucleated) and prokaryotes (non-nucleated). Confusing the two leads to misunderstandings about evolution and disease mechanisms.
Another error is assuming ribosomes are free-floating. While some ribosomes exist independently in the cytoplasm, others bind to the rough endoplasmic reticulum. A correct diagram shows this dual localization.
I once observed a student mislabel a mitochondrion as a lysosome because both appear as small spheres in low-resolution images. High-quality diagrams use distinct shapes and shading to prevent such errors.
Consider a standard diagram of a human hepatocyte (liver cell). The nucleus occupies the center, with dark chromatin visible. Surrounding it are numerous mitochondria, each with folded cristae.
The rough ER lines the periphery, studded with ribosomes. These structures synthesize proteins like albumin and clotting factors. The Golgi apparatus appears as stacked cisternae near the nucleus, modifying and packaging proteins for secretion.
Lysosomes are small, round vesicles scattered throughout. They break down toxins and old organelles. The cell's cytoplasm contains microfilaments and intermediate filaments forming the cytoskeleton, which maintains shape and enables intracellular transport.
When comparing this to a bacterial cell diagram, the absence of a nucleus and membrane-bound organelles becomes clear. The nucleoid is a concentrated DNA area, and the cell wall provides protection against osmotic pressure.
Understanding these differences prevents confusion in microbiology and immunology. For example, antibiotics like penicillin target bacterial cell walls-structures absent in human cells-and this is evident in a proper diagram of a cell.