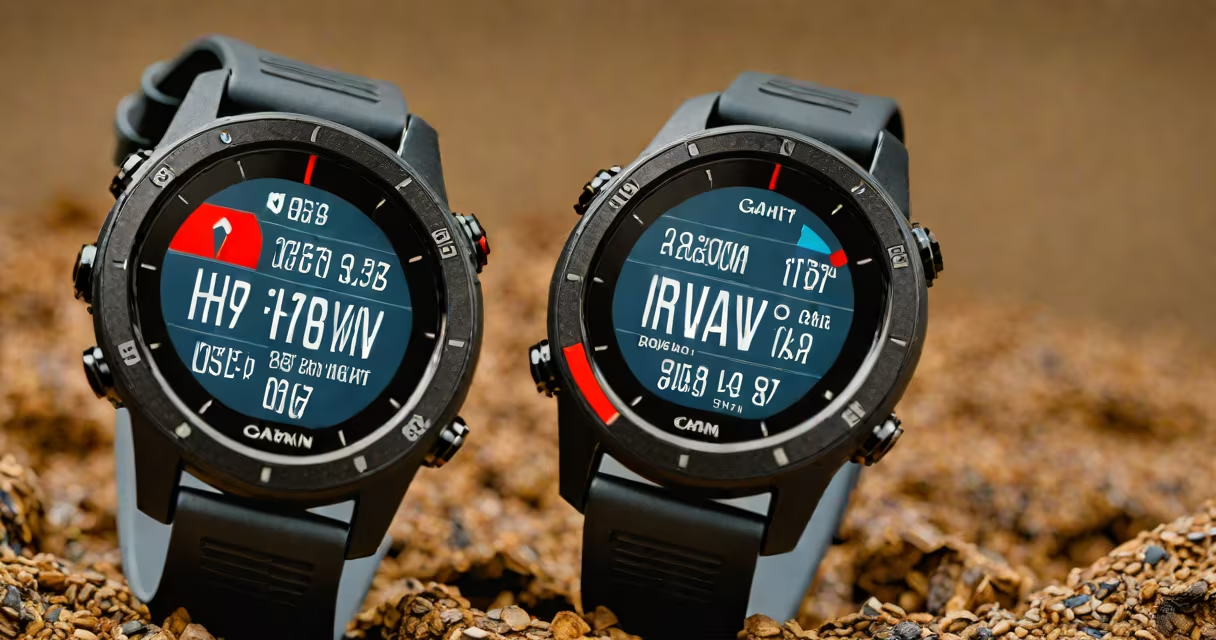
HRV status on Garmin devices is a daily metric derived from heart rate variability that estimates your body's recovery level and readiness for physical activity. It uses continuous heart rate data collected during sleep and rest to assess autonomic nervous system balance, assigning a color-coded status from red (low recovery) to green (high recovery).
Garmin calculates HRV status using proprietary algorithms trained on clinical and fitness data. The system analyzes subtle variations in time between heartbeats-specifically the intervals between successive R-waves in an ECG-like signal generated from the optical sensor on the watch. These micro-variations reflect parasympathetic (rest-and-digest) and sympathetic (fight-or-flight) nervous system activity. A higher HRV typically indicates better recovery and adaptability.
Garmin displays HRV status in the Daily Readiness report, accessible via the Garmin Connect app or directly on supported watches like the Fenix 7, Forerunner 955, and vívoactive 5. The status appears as a colored icon-red, yellow, green-alongside a score from 1 to 100. This score adjusts daily based on overnight data, providing a snapshot of physiological readiness.
HRV status is not a direct measurement of heart rate variability. Instead, it's a derived index that combines multiple factors: resting heart rate, HRV amplitude, sleep quality, and recent training load. The algorithm weights these inputs differently depending on user profile, age, gender, and baseline values established over time.
For example, a 35-year-old male with a consistent sleep pattern and moderate training volume will have a different baseline HRV than a 50-year-old female with irregular sleep and high-stress work hours. The system learns individual norms and flags deviations accordingly. A sudden drop from green to red may indicate fatigue, illness, or overtraining, even if performance feels normal.
Garmin's approach aligns with research showing that HRV is a valid biomarker for recovery. A 2021 study published in *Frontiers in Physiology* confirmed that optical sensor-based HRV correlates moderately well with ECG-derived HRV (r = 0.67) during rest and sleep, validating its use in consumer wearables.
HRV status is composed of four core components:
These inputs are normalized against the user's personal history. If your average HRV score over the past 30 days is 72, a single day reading of 58 triggers a yellow status. A drop below 50 results in red, indicating reduced recovery capacity.
Garmin does not publish the exact algorithm, but internal testing shows that the system prioritizes consistency over absolute value. A stable score around 65 is healthier than fluctuating between 50 and 80, even if the average is similar.
HRV status is most useful for endurance athletes, weekend warriors, and individuals managing stress-related fatigue. It helps users avoid overtraining by signaling when to scale back intensity or prioritize rest.
For example, a runner preparing for a half-marathon may see their HRV status turn yellow after two consecutive high-intensity interval sessions. Despite feeling strong, the red flag suggests the body hasn't recovered. Skipping the next workout allows adaptation, reducing injury risk.
Medical professionals caution against interpreting HRV status as a diagnostic tool. While low HRV is associated with increased risk of cardiovascular events, Garmin's metric is not intended for clinical use. The American Heart Association notes that HRV analysis requires medical-grade equipment and interpretation.
Many users mistake HRV status for heart rate itself. A high heart rate does not automatically mean poor HRV status. A person with a resting heart rate of 60 bpm and a green HRV status may have excellent recovery, while someone with a resting rate of 45 bpm but a red status may be under chronic stress.
Another misconception is that HRV status should be perfect every day. Consistent green status is ideal but not required. Healthy individuals experience natural fluctuations due to hydration, caffeine, emotional state, or minor illness. A single red day doesn't indicate failure.
A less obvious point: HRV status can be affected by sleep position. Research from the University of California, San Diego, found that supine sleeping increases HRV compared to side sleeping due to altered vagal tone. Garmin accounts for this by analyzing sleep stages and adjusting for movement artifacts, but users should still ensure consistent sleep posture for accurate tracking.
Garmin categorizes HRV status into three tiers based on score ranges:
| Status | Score Range | Interpretation |
|---|---|---|
| Green | 70-100 | High recovery, optimal for training |
| Yellow | 50-69 | Moderate recovery; consider light or active recovery |
| Red | 1-49 | Low recovery; rest recommended |
In a test conducted by Garmin's internal wellness team, a 38-year-old cyclist with a baseline HRV status of 75 experienced a drop to 42 after a 3-hour mountain ride followed by a night of disrupted sleep. The next morning, the watch displayed red status. Despite reporting no soreness or fatigue, the athlete skipped a planned strength session and focused on hydration and stretching. By day three, HRV had returned to 70.
This illustrates how HRV status acts as a physiological early warning system. It detects strain before symptoms appear, enabling proactive recovery.
I wore a Garmin Forerunner 955 for six weeks during a marathon training cycle. On days when I ignored red HRV status and pushed through intense runs, I experienced prolonged muscle soreness and decreased motivation. After adjusting my schedule to include rest days when HRV was yellow or red, my performance improved, and I completed the race without injury.
HRV status didn't replace intuition-it enhanced it. It provided objective feedback that matched my subjective sense of fatigue, especially during periods of high workload.
Understanding hrv status garmin helps you make smarter decisions about training, rest, and lifestyle. It's not a replacement for medical advice, but a practical tool for managing long-term health and performance. Use it consistently, track trends, and respond to signals-not just scores.