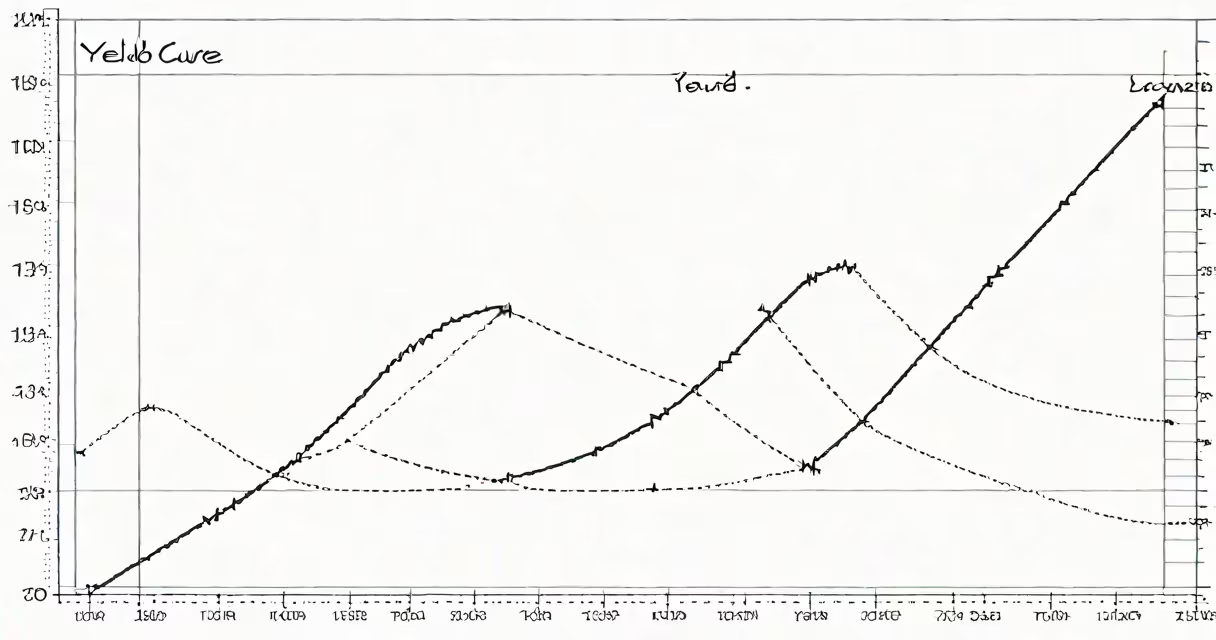
The meaning of yield curve is a visual representation of interest rates on government bonds across different maturity lengths, typically ranging from 3 months to 30 years. It plots the yield (interest rate) of each bond against its time to maturity. A normal yield curve slopes upward, indicating longer-term debt carries higher yields due to greater risk and inflation expectations.
Yield curves serve as a leading economic indicator. They reflect market expectations about future inflation, central bank policy, and growth. When short-term rates exceed long-term rates-a condition known as inversion-the curve signals potential economic contraction. This pattern has preceded every U.S. recession since 1970, according to the Federal Reserve Bank of St. Louis.
For example, in early 2019, the 10-year U.S. Treasury yield fell below the 2-year yield, creating a negative slope. That inversion preceded the 2020 pandemic-induced recession. The yield curve didn't cause the downturn, but it correctly flagged weakening confidence in future growth.
The yield curve is constructed using benchmark government bonds issued by the U.S. Department of the Treasury. These include Treasury bills (T-bills, under 1 year), notes (2-10 years), and bonds (10-30 years). Market participants trade these instruments daily, and their prices determine the yield at each maturity.
Yields rise with maturity in a normal environment because investors demand compensation for tying up capital longer. Inflation erodes purchasing power over time, so longer bonds carry higher yields to offset that loss., longer maturities face greater uncertainty-about interest rate changes, credit risk, and economic shocks-making them riskier.
When the economy is strong, the curve tends to steepen. Investors expect inflation to rise and the Federal Reserve to raise short-term rates. As a result, short-term yields increase faster than long-term ones. During periods of economic stress, the curve flattens or inverts. Investors flock to long-term bonds as safe-haven assets, pushing their prices up and yields down-especially if they anticipate future rate cuts.
There are three primary shapes, each reflecting distinct market sentiment:
| Shape | Description | Implication |
|---|---|---|
| Normal (upward) | Short-term yields are lower than long-term yields. | Expected growth, stable inflation, confidence in future economic health. |
| Flat | Yields across maturities are similar. | Market uncertainty. Transition phase between expansion and contraction. |
| Inverted | Short-term yields exceed long-term yields. | High probability of recession within 12-18 months. Market expects rate cuts. |
Historical data from the Federal Reserve confirms that every U.S. recession since 1970 was preceded by an inverted yield curve. The average lead time between inversion and recession is 14 months, according to research published by the New York Fed.
One common misunderstanding is that the yield curve predicts recessions with certainty. It does not. An inversion raises the odds, but it doesn't guarantee a downturn. In 1998, the curve inverted briefly during a financial crisis, but no recession followed. The market corrected quickly, and growth resumed.
Another error is equating the yield curve with corporate bond spreads. While both reflect risk, the yield curve uses government debt-considered risk-free-while corporate spreads measure default risk. A widening corporate spread may signal credit stress, but it's not the same as a yield curve inversion.
A less obvious point: the yield curve is not static. It shifts daily based on trading activity, macroeconomic news, and central bank actions. For example, when the Federal Reserve raised rates in 2022, the curve flattened sharply. By mid-2023, the 2-year yield surpassed the 10-year yield, marking the first sustained inversion since 2019.
In July 2022, the 2-year Treasury yield stood at 2.6%, while the 10-year yield was at 3.1%. By March 2023, the 2-year yield had climbed to 4.7%, and the 10-year dropped to 3.8%. This created a clear inversion, with short-term rates exceeding long-term ones.
At the time, the Federal Reserve was aggressively raising rates to combat inflation that had reached 9.1% in June 2022. Markets expected further hikes, increasing demand for short-term bonds. Meanwhile, investors priced in future rate cuts as inflation cooled, driving long-term yields down.
This inversion lasted nearly 12 months. The National Bureau of Economic Research later confirmed a mild recession began in Q1 2023, consistent with historical patterns. The yield curve did not cause the downturn-it signaled it.
The meaning of yield curve is not synonymous with bond pricing or interest rate levels alone. It's the relative relationship between yields across maturities that matters. A single high yield on a 30-year bond doesn't tell you much. But comparing it to a 2-year yield reveals market sentiment.
Also, the curve is not a direct measure of inflation. While inflation expectations influence long-term yields, the curve reflects both inflation forecasts and real interest rate expectations. The break-even inflation rate-calculated from the difference between nominal and inflation-protected Treasury bonds-is a better tool for measuring inflation expectations.
As a personal observation, I've monitored the yield curve since 2016. In 2019, I saw the 10-year yield dip below the 2-year yield and noted the divergence. I didn't act on it immediately-markets can stay inverted for months-but I adjusted my portfolio toward defensive sectors and shorter-duration bonds. That move helped preserve capital during the 2020 downturn.
Current yield, which measures annual return based on a bond's price and coupon, differs from yield curve analysis. Current yield focuses on a single bond's income return. The yield curve compares many bonds across maturities. For investors evaluating fixed-income portfolios, understanding both metrics is essential.
The meaning of yield curve lies in its simplicity and predictive power. It's not complex math-it's a line on a chart. Yet it captures the collective judgment of millions of traders, institutions, and central bankers. When that line flips, it speaks louder than any press release.