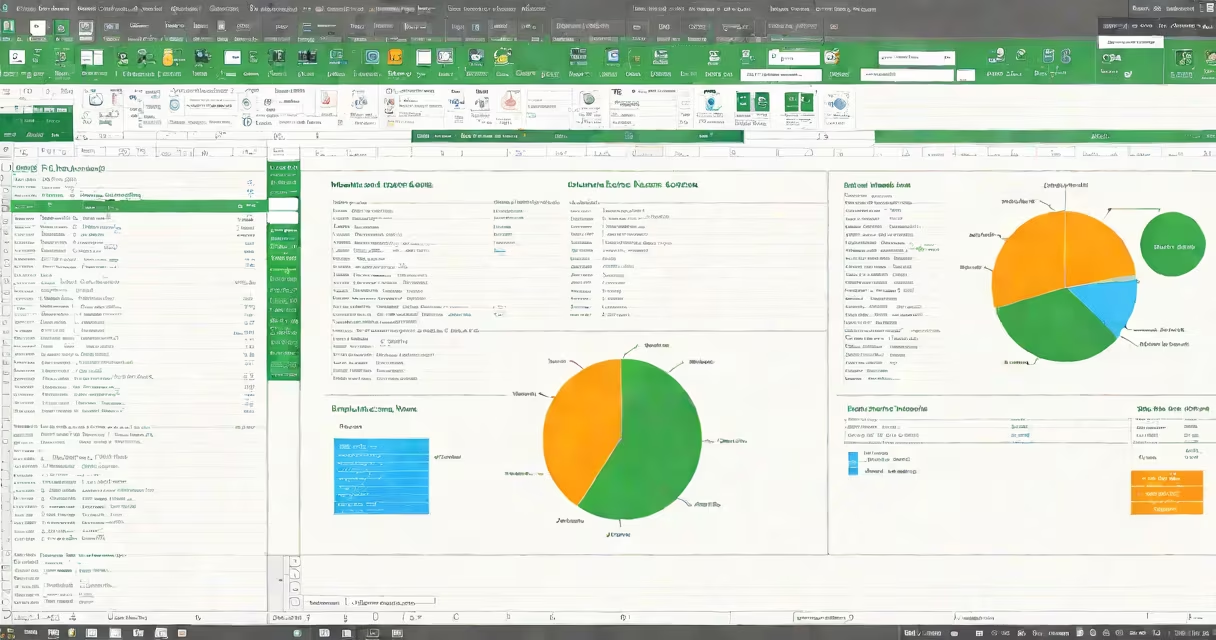
Microsoft Excel basics refer to the core functions and interface elements users need to create, manage, and analyze data in spreadsheets. This includes entering data into cells, using basic formulas like SUM and AVERAGE, going through rows and columns, and formatting content for clarity. These skills form the foundation for handling tasks ranging from budget tracking to inventory management.
Excel operates on a grid system made of intersecting rows and columns. Each intersection is a cell, identified by a column letter and row number (e.g., A1, B5). Data enters these cells as text, numbers, or formulas. Formulas begin with an equals sign (=) and perform calculations based on cell references. For example, typing =SUM(A1:A10) adds values from A1 through A10.
Understanding the ribbon at the top of the window is essential. It groups tools into tabs like Home, Insert, and Formulas. The Home tab contains common actions such as font formatting, alignment, and cell coloring. The Formulas tab hosts functions like VLOOKUP and IF statements, which automate decision-making in data sets.
Every Excel workbook contains one or more worksheets. Each worksheet holds up to 1,048,576 rows and 16,384 columns. This structure allows large-scale data entry and analysis. Cells can hold static values or changing formulas that recalculate when inputs change.
Formulas are the engine behind Excel's power. Simple arithmetic operations use standard symbols: + (addition), - (subtraction), * (multiplication), / (division). More complex expressions combine multiple operations. For example, =A1*B1+C1 multiplies the value in A1 by B1, then adds C1.
Named ranges improve readability and reduce errors. Instead of referencing cell B2 repeatedly, you can assign it a name like "TaxRate" and use it in formulas. To do this, select the cell, go to the Name Box (left of the formula bar), type the name, and press Enter. Later, a formula like =TotalSales*TaxRate becomes easier to understand and maintain.
There are three primary types of data used in Excel: numeric, text, and date/time. Numeric entries support mathematical operations. Text entries are treated as labels unless used in functions like CONCATENATE or TEXTJOIN. Date/time values enable sorting and time-based calculations.
| Type | Examples | Use Cases |
|---|---|---|
| Numeric | 42, 3.14, -100 | Budgets, sales totals, scores |
| Text | "John Doe", "Q1 Sales" | Names, categories, headers |
| Date/Time | 1/15/2024, 9:30 AM | Deadlines, transaction timestamps |
For example, a small business owner uses Excel to track monthly expenses. They enter each expense in a column labeled "Category," with amounts in the adjacent column. Using =SUM(B2:B100), they calculate total spending. Conditional formatting highlights entries over $100, helping identify high-cost areas quickly.
Many assume Excel is only for financial reports. In reality, it supports diverse applications: scheduling, inventory logs, project timelines, and even personal goal tracking. A student used Excel to log daily study hours and visualize progress over a semester-no accounting involved.
Another misconception is that formulas must be typed manually. Excel offers auto-fill and function suggestions. As you start typing =AVERAGE(, a dropdown appears showing available functions. Selecting AVERAGE inserts the syntax, and Excel prompts for arguments. This reduces typos and speeds up work.
A lesser-known feature is Flash Fill (available under the Data tab). It detects patterns in data and fills in missing values automatically. For instance, if you have a list of full names in column A and want to extract last names, type the last name in the first row of column B, then use Flash Fill. Excel recognizes the pattern and completes the rest.
Consider a household creating a monthly budget. Set up columns: Category (A), Budgeted Amount (B), Actual Spend (C), and Variance (D).
=C2-B2 and copy down. Positive values indicate overspending.=SUM(B2:B5) in a summary row to see total budget.This setup reveals that entertainment was under budget by $20, while groceries exceeded by $20. Adjustments can be made early in the month.
I built a similar tracker during a freelance project and noticed that recurring subscriptions were inflating my monthly costs. After identifying them in Excel, I canceled two services, saving $65 per month. The visual breakdown made the impact clear.
Users sometimes mix up Excel with Google Sheets. Both handle spreadsheets, but Excel offers deeper functionality for advanced users. For example, Excel supports macros written in VBA (Visual Basic for Applications), enabling automated workflows. Google Sheets lacks native VBA support, relying on Apps Script instead.
Another confusion arises between Excel and databases like Access. While both store data, Excel is designed for analysis and visualization. Access excels at managing large datasets with relationships between tables. Excel is better suited for summarizing data, creating charts, and running quick calculations.
According to Microsoft's official documentation, Excel's formula engine processes over 1 million calculations per second on modern hardware. This performance enables real-time updates in complex models, such as forecasting sales based on historical data.
Mastering microsoft excel basics equips users to manage information effectively across personal and professional contexts. From organizing a grocery list to modeling business growth, the skills apply broadly and scale with practice.