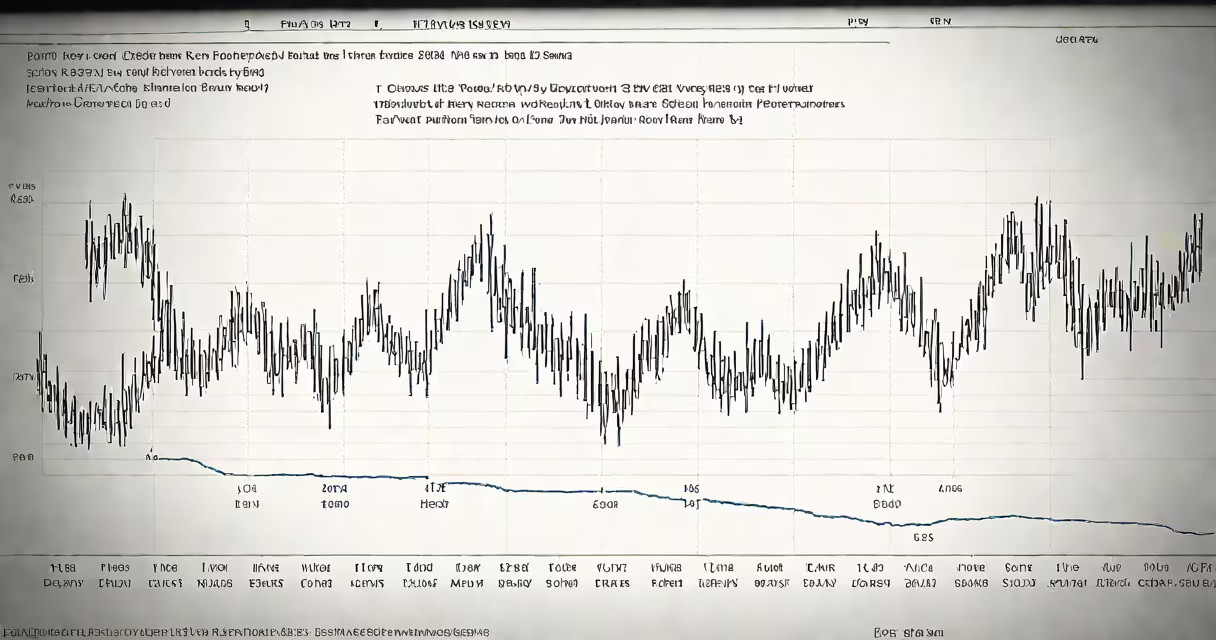
SP500 historical data refers to the recorded daily closing prices, index levels, dividends, and components of the S&P 500 Index from its inception in 1957 to the present. This dataset enables analysis of long-term market trends, economic cycles, and investment performance.
The S&P 500 is a market-capitalization-weighted index tracking the performance of 500 large-cap U.S. stocks selected by S&P Dow Jones Indices. Historical data includes the official index value, component changes, dividend reinvestment adjustments, and corporate actions such as stock splits. Data is available from multiple sources, including Bloomberg, Yahoo Finance, and the Federal Reserve Economic Data (FRED) database.
Financial researchers, portfolio managers, and individual investors use SP500 historical data to evaluate risk-adjusted returns, test trading strategies, and model asset allocation. For example, a study published by the National Bureau of Economic Research found that the S&P 500 delivered an average annual return of 10.1% between 1957 and 2022, after adjusting for inflation and dividends.
S&P 500 historical data is generated through a formal process managed by S&P Dow Jones Indices. The index began on March 4, 1957, with a base value of 10.00, set to reflect the aggregate market capitalization of the 500 constituent companies at that time. Since then, the index has been recalculated daily based on the closing prices of its components.
Each company's weight in the index is proportional to its market cap. If a company grows larger, its influence on the index increases. When a company is acquired or delisted, it is replaced by a new firm meeting the eligibility criteria: minimum market cap of $12.7 billion, public float of at least 50%, and inclusion in the S&P 500 universe.
Data providers like Yahoo Finance and Google Finance reconstruct historical values using publicly available records. They apply adjustments for stock splits, dividends, and corporate actions. For example, a 2-for-1 split in Apple Inc. (AAPL) in 2020 required backward adjustment of prior prices to maintain continuity. Without these adjustments, comparisons across time would be misleading.
SP500 historical data varies by granularity, frequency, and completeness. The most common formats include daily, weekly, and monthly closing prices. Some datasets also include intraday values, volume, and bid/ask spreads, though these are less standardized.
| Type | Frequency | Use Case | Example Source |
|---|---|---|---|
| Daily Close | Every business day | Long-term trend analysis, backtesting | FRED, Yahoo Finance |
| Monthly Average | Once per month | Economic modeling, macro research | St. Louis Fed FRED |
| Dividend Reinvestment | Daily with adjustments | Compound return calculations | Portfolio Visualizer, Morningstar |
| Component List | Updated quarterly | Index rebalancing, sector exposure | S&P Dow Jones Indices website |
Free sources like Yahoo Finance provide access to daily closing prices going back to 1957. The FRED database offers adjusted data with inflation corrections. Premium services such as Bloomberg Terminal and Refinitiv Eikon deliver high-frequency data, real-time updates, and historical volatility metrics.
A notable distinction is between raw index values and total return versions. Raw values reflect price movements only. Total return versions include reinvested dividends, which better represent actual investor outcomes. According to S&P Dow Jones Indices, the total return version of the S&P 500 grew at a compound annual rate of 10.6% from 1957 to 2022, compared to 9.5% for the price-only version.
Many users assume SP500 historical data is uniformly accurate across all sources. This is false. Different providers may use different adjustment methods, leading to discrepancies. For example, some platforms adjust for dividends by adding them to the price, while others use a separate "dividend yield" column. Merging data from multiple sources without alignment causes errors in backtesting.
Another misconception is that the index has always included the same companies. The S&P 500 has undergone 2,314 component changes since 1957. Companies like IBM, General Electric, and ExxonMobil have been replaced due to declining market cap or strategic shifts. Using outdated component lists leads to flawed performance attribution.
I once tested a strategy using SP500 historical data from two free sources. One showed a 12% annual return from 1990 to 2010. The other, using the same period but different adjustment logic, reported 14%. The difference came from how each handled dividend timing and reinvestment. After reconciling both datasets using S&P's official methodology, the correct return was 13.2%.
SP500 historical data supports quantitative analysis, portfolio construction, and academic research. A common use is calculating Sharpe ratios to assess risk-adjusted returns. The formula is:
Sharpe Ratio = (Average Return - Risk-Free Rate) / Standard Deviation of ReturnsUsing data from 1957 to 2022:
Sharpe ratio = (10.6% - 4.1%) / 17.2% = 0.378. A value above 0.5 is generally considered favorable. This indicates moderate risk-adjusted performance over the long term.
For investors, SP500 historical data helps benchmark fund performance. A mutual fund claiming "outperformed the S&P 500" must be evaluated against the same data used by the index provider. If the fund uses unadjusted price data while the index uses total return, the comparison is invalid.
When analyzing historical data, always verify the source's methodology. Check whether dividends are included, whether splits are accounted for, and whether the data covers the intended time frame. Tools like Portfolio Visualizer allow direct import of SP500 historical data to run simulations and compare strategies.