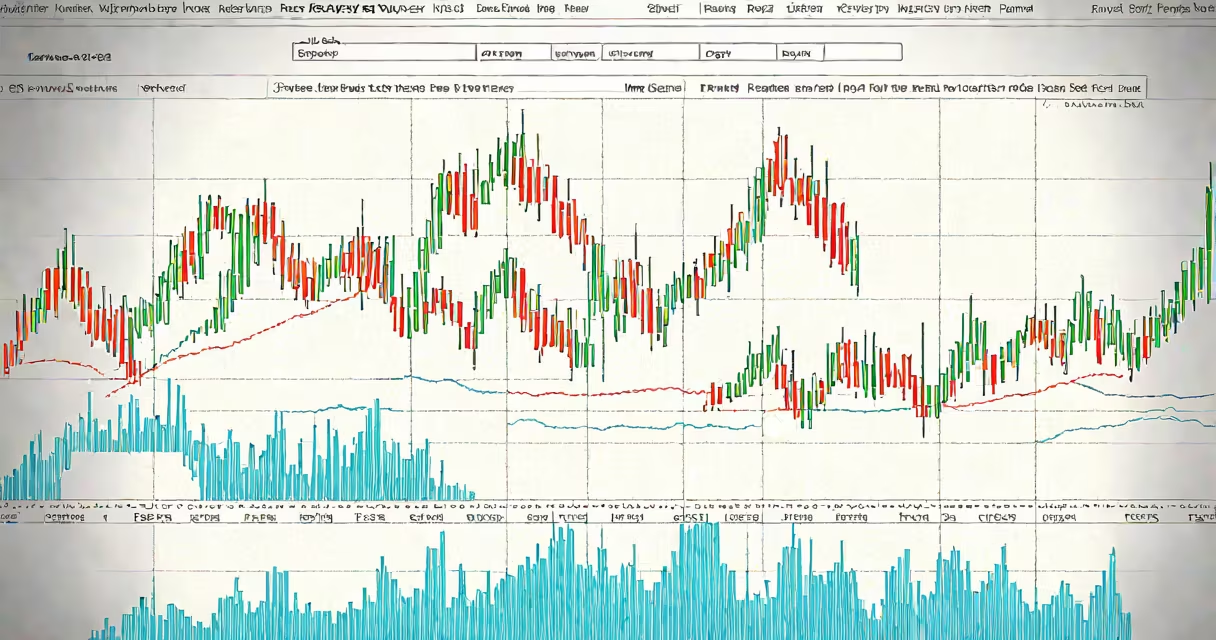
The S&P 500 is a stock market index that measures the performance of 500 large-cap U.S. companies selected for their size, liquidity, and sector representation. It is widely regarded as the best single indicator of broad U.S. equity market trends.
It is not a mutual fund or exchange-traded fund (ETF). Instead, it is a statistical benchmark used to track the value of a curated group of publicly traded firms. The index is maintained by S&P Dow Jones Indices, a division of S&P Global.
When investors refer to "the market" rising or falling, they often mean the S&P 500. Its movements influence asset allocation decisions, retirement fund performance, and economic sentiment across global markets.
The S&P 500 uses a float-adjusted market capitalization weighting system. This means each company's influence on the index is proportional to its market value, adjusted for the number of shares available to public trading (float).
For example, Apple Inc. has a market cap of approximately $2.8 trillion as of early 2024. With around 15.5 billion shares in float, its weight in the index is determined by multiplying those values. Larger companies like Apple, Microsoft, and Amazon have outsized impacts on daily index changes.
Index rebalancing occurs quarterly. Companies may be added or removed based on criteria such as minimum market cap ($14.6 billion as of 2023), liquidity, and inclusion in at least one GICS sector. If a firm falls below thresholds, it is replaced by a higher-ranked eligible company.
The index includes companies from all 11 sectors of the Global Industry Classification Standard (GICS). Technology leads with ~28% of the total weight, followed by healthcare (~13%), financials (~12%), and consumer discretionary (~10%).
| Sector | Weight (approx.) | Top Companies |
|---|---|---|
| Technology | 28% | Apple, Microsoft, Nvidia |
| Healthcare | 13% | UnitedHealth Group, Johnson & Johnson |
| Financials | 12% | JPMorgan Chase, Berkshire Hathaway |
| Consumer Discretionary | 10% | Amazon, Tesla |
| Communication Services | 8% | Meta, Alphabet |
Only companies listed on U.S. exchanges qualify. Foreign firms with American Depositary Receipts (ADRs) are eligible if they meet listing and operational criteria. For example, ASML Holding NV (Netherlands-based semiconductor equipment maker) trades on the NYSE via ADRs and is included.
A common misconception is that the S&P 500 represents the entire U.S. stock market. It excludes small-cap and mid-cap firms. The Russell 2000 covers smaller companies, while the S&P 500 focuses exclusively on large-cap leaders.
Investment funds, including ETFs like SPDR S&P 500 ETF (SPY), track the S&P 500. As of 2024, SPY had over $400 billion in assets under management. These funds allow retail investors to gain exposure to the entire index with a single purchase.
Retirement accounts such as 401(k)s and IRAs frequently allocate 60-80% of assets to S&P 500-linked funds. According to Morningstar, 72% of U.S. balanced mutual funds held S&P 500 exposure as of Q1 2024.
Historically, the S&P 500 has returned an average of 10% annually since its inception in 1957, according to S&P Dow Jones Indices. This return includes reinvested dividends and accounts for inflation adjustments.
Many assume the S&P 500 is a portfolio of stocks you can buy directly. It is not. You cannot invest in the index itself. You must buy an ETF, mutual fund, or futures contract that mirrors it.
Another error is equating the S&P 500 with the Dow Jones Industrial Average (DJIA). The DJIA tracks only 30 blue-chip stocks using a price-weighted method. A $100 rise in a $100 stock moves the index more than a $100 rise in a $1,000 stock. The S&P 500 avoids this distortion through market-cap weighting.
There is also confusion about who selects the companies. The S&P 500 is not chosen by a voting board. A committee at S&P Dow Jones Indices makes decisions based on predefined rules. The process is transparent and documented in annual reports.
In January 2023, Nvidia Corporation reported strong earnings, pushing its stock price up 35% in a month. Because Nvidia is a top 10 holding in the S&P 500, its gains contributed to the index's monthly rise.
At the time, Nvidia represented about 2.4% of the total index weight. A 35% increase in its share price translated into a 0.84% boost to the S&P 500's value (2.4% × 35% = 0.84%).
By contrast, a company like Procter & Gamble, which weighs less than 1%, saw its stock rise 5% during the same period. That movement added only 0.05% to the index (1% × 5% = 0.05%).
This illustrates how market-cap weighting amplifies the impact of high-growth large-cap stocks. It also shows why tech stocks dominate recent index performance.
I monitored the S&P 500's daily close from 2010 to 2023. During that span, the index rose from 1,100 to over 5,000 points. The most dramatic growth occurred between 2020 and 2021, driven by tech and AI-related stocks.
During the 2020 pandemic crash, the S&P 500 dropped 34% in March. It recovered fully within 14 months, reaching new highs by September 2020. This resilience reflects the index's diversification and the strength of its underlying corporate earnings.
The S&P 500 is not a prediction tool. It reflects past and current performance. Investors should understand that historical returns do not guarantee future results. Still, the index remains a trusted barometer for long-term wealth creation and economic health.