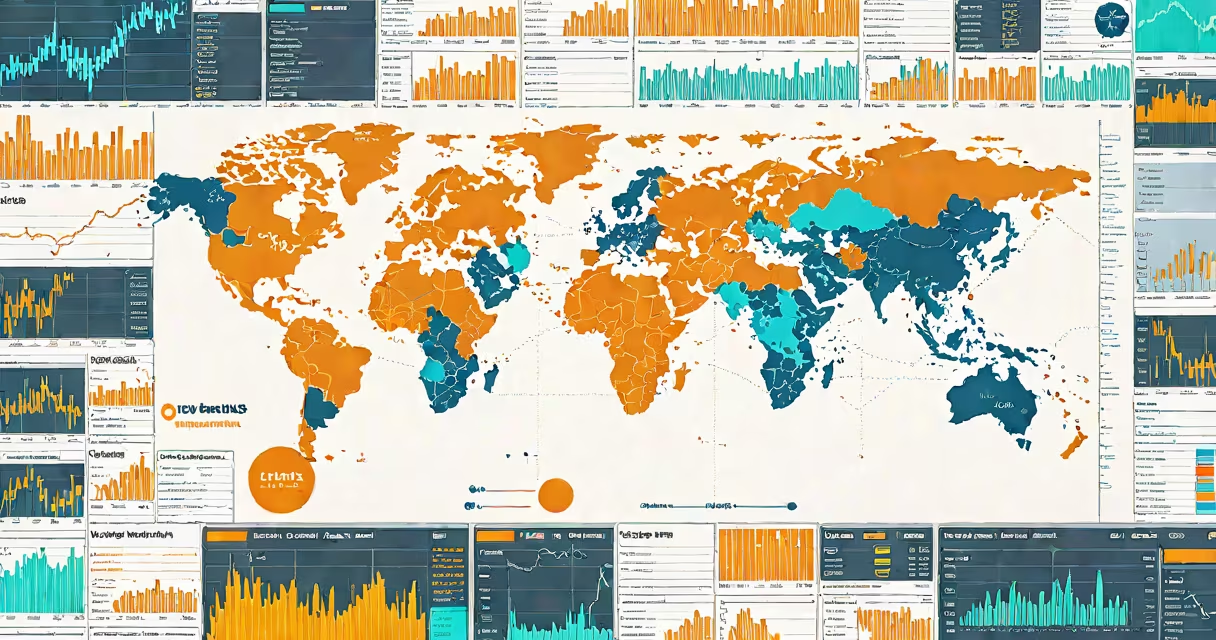
Bloomberg Market Capitalisation is a real-time metric that aggregates the total market value of publicly traded equities across global exchanges, updated continuously throughout trading hours. It reflects the collective valuation of companies based on share price and outstanding shares, serving as a changing indicator of global equity market size.
This metric is generated using data from Bloomberg Terminal, a financial information platform used by institutional investors, traders, and analysts. It aggregates values from thousands of listed companies across developed and emerging markets, providing a consolidated view of total equity market value at any given moment.
Unlike static annual reports or end-of-day figures, Bloomberg Market Capitalisation updates every few seconds during active trading sessions. This allows users to track shifts in market value due to news events, earnings releases, or macroeconomic changes in near real time.
Bloomberg Market Capitalisation calculates each company's market cap by multiplying its current share price by the number of shares outstanding. For example, if Apple Inc. trades at $180 per share and has 16.5 billion shares outstanding, its market cap is $2.97 trillion. Bloomberg sums these values across all listed securities globally.
The system uses standardized identifiers such as ISINs and ticker symbols to match instruments across exchanges. Data feeds are sourced directly from stock exchanges, regulatory filings, and liquidity providers, ensuring consistency and timeliness.
For multinational firms, Bloomberg assigns ownership based on primary listing. A company like Samsung Electronics, listed on the Korea Exchange, contributes its market cap to the global total under its home market, not its U.S. depository receipts.
Bloomberg Market Capitalisation is available at multiple levels of granularity:
| Level | Description | Use Case |
|---|---|---|
| Global Total | Sum of all listed equities worldwide | Tracking market health |
| Regional | Breakdown by continent or economic bloc (e.g., Europe, ASEAN) | Comparing regional performance |
| Industry Sector | Grouped by GICS classification (e.g., Information Technology, Healthcare) | Identifying sector momentum |
| Single Company | Individual firm's market cap | Assessing company size relative to peers |
For instance, in early 2024, the global market cap of equities exceeded $110 trillion, with the U.S. contributing approximately $45 trillion, China $12 trillion, and Japan $6 trillion. These figures are updated live on Bloomberg Terminal terminals used by asset managers and central banks.
A common misconception is that Bloomberg Market Capitalisation includes private equity or unlisted assets. It does not. Only publicly traded stocks are included. Private companies, venture-backed startups, and non-traded real estate are excluded, even if they have high valuations.
Bloomberg Market Capitalisation is often mistaken for "total market capitalisation" as a standalone concept. While both measure aggregate equity value, the term "total market capitalisation" lacks specificity. Bloomberg Market Capitalisation is a branded, systematized version of that idea, tied to a specific data infrastructure.
Another error is assuming that market cap reflects intrinsic value. It does not. Market cap is a function of supply and demand, investor sentiment, and speculative behavior. A company with a $1 trillion market cap may still be losing money or operating at a negative free cash flow. The metric shows what the market is willing to pay, not whether that price is justified.
For example, in 2022, Nvidia's market cap surged past $1 trillion within months after announcing AI chip breakthroughs. This rise was driven by expectations of future revenue, not current earnings. Bloomberg Market Capitalisation captured the shift instantly, reflecting investor optimism rather than fundamental performance.
Investment professionals use Bloomberg Market Capitalisation to assess portfolio risk exposure. A fund manager tracking a global equity strategy can monitor how much of their portfolio's value is concentrated in large-cap tech stocks versus small-cap industrials.
Central banks also reference the metric during monetary policy discussions. The Federal Reserve's FOMC meetings sometimes cite global market cap trends to evaluate systemic risk. According to a 2023 report from the Board of Governors of the Federal Reserve System, rising market caps correlate with increased use in corporate balance sheets, which can signal growing financial fragility.
I once observed a hedge fund trader use Bloomberg Market Capitalisation during a 2023 flash crash in European equities. When the DAX dropped 4% in under 15 minutes, the trader accessed real-time market cap data to identify which sectors were bleeding value fastest. Energy and materials saw disproportionate declines, prompting a tactical shift in allocation. The data enabled a response within seconds, not hours.
Bloomberg Market Capitalisation relies on verified exchange data and excludes penny stocks, shell companies, and delisted securities. It applies strict filters to avoid double-counting, such as excluding dual-listed shares unless they're traded in different currencies.
According to Bloomberg L.P.'s official documentation, the system uses a "weighted aggregation model" that accounts for currency conversion rates and exchange volatility. This ensures accurate cross-border comparisons. For example, a €100 billion market cap in Germany is converted to USD using real-time FX rates, not historical averages.
When comparing with alternative sources, consider that S&P Global's "Global Market Cap Index" uses a different methodology. It weights components by float-adjusted market cap and rebalances quarterly. Bloomberg's version is more fluid, designed for intraday analysis.
Bloomberg Market Capitalisation is not a prediction tool. It's a snapshot of current valuation. But when paired with fundamentals, technical indicators, and macroeconomic data, it becomes a useful diagnostic tool for understanding where capital flows are headed.