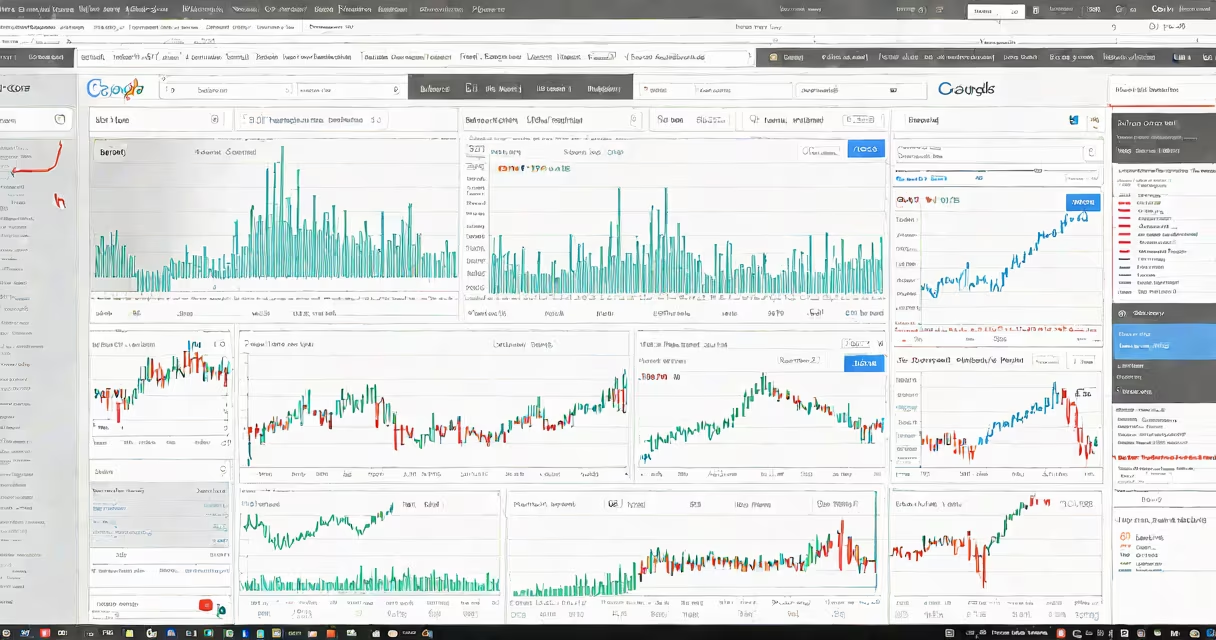
Google Stock TradingView is a real-time financial charting platform that displays live price data, technical indicators, and historical trends for Alphabet Inc.'s Class A shares (GOOGL) using TradingView's web-based analytics engine.
TradingView integrates market data feeds from exchanges and brokers, enabling users to view GOOGL stock prices with millisecond precision. The platform supports customizable charts, drawing tools, and algorithmic alerts based on price movements, volume spikes, and technical patterns such as moving averages, RSI, MACD, and Bollinger Bands.
Users access Google Stock TradingView through a browser or mobile app. No software installation is required. The interface allows direct comparison between GOOGL and other tech stocks like MSFT, AAPL, or NVDA, and supports multi-timeframe analysis from 1-minute intervals to monthly charts.
When you open a GOOGL chart on TradingView, the system pulls live bid/ask prices from major U.S. exchanges like Nasdaq. Data updates occur every 15 seconds during market hours (9:30 AM - 4:00 PM ET), with delayed data available outside those times.
Behind the scenes, TradingView uses WebSocket protocols to stream price changes in real time. This enables instant visualization of price action, including candlestick patterns, support/resistance levels, and volume profiles. Users can apply custom scripts written in Pine Script-a domain-specific language-to automate technical analysis.
For example, a trader might set an alert when GOOGL's 14-day RSI drops below 30 (indicating potential oversold conditions) and the 50-period moving average crosses above the 200-period MA (a "golden cross" signal). These triggers fire instantly when thresholds are met, even if the user is not actively viewing the chart.
TradingView offers several features tailored for analyzing Google stock:
A notable feature is the ability to save chart layouts as templates. Traders can create a "GOOGL Watchlist" layout with multiple timeframes, indicator sets, and annotations-then reuse it across sessions.
Many assume Google Stock TradingView provides direct trading capabilities. It does not. TradingView is a charting and analysis tool, not a brokerage. To buy or sell GOOGL shares, users must connect to a supported broker like Interactive Brokers, Fidelity, or Charles Schwab through TradingView's integrated trading interface.
Another misconception is that all data on TradingView is free. While basic charting is free, advanced features require a paid subscription. Free-tier users see limited historical data depth and fewer indicators. For example, the free version shows only 10 years of daily data, while Pro subscribers gain access to 30 years of intraday records.
Some confuse GOOGL with GOOG-the original Class C shares. GOOGL trades under a different ticker and has no voting rights. As of Q1 2024, GOOGL represented 98.7% of Alphabet's market capitalization. Using the wrong ticker leads to inaccurate analysis.
In January 2024, GOOGL broke above $160 on high volume after reporting stronger-than-expected AI revenue. A trader using Google Stock TradingView noticed this pattern:
At 10:15 AM ET, GOOGL spiked above $160. The RSI rose from 58 to 72 within 15 minutes, signaling momentum. Volume increased by 140% compared to the 30-day average. The trader confirmed the breakout with a bullish engulfing candle on the 1-hour chart.
Using Pine Script, they automated an alert: "Alert when GOOGL closes above $160 with RSI > 70 and volume > 1.2x 30-day avg." The alert fired at 10:22 AM, confirming the move was not a false signal.
This workflow demonstrates how TradingView supports rapid decision-making based on objective data rather than emotion.
The following table compares Google Stock TradingView with two common alternatives:
| Feature | TradingView | Yahoo Finance | Investing.com |
|---|---|---|---|
| Real-time data (US markets) | Yes (free tier: 15 sec delay) | No (15-min delay) | Yes (free tier: 15-min delay) |
| Pine Script support | Yes (custom strategies) | No | Yes (limited scripting) |
| Mobile app availability | Yes (iOS & Android) | Yes | Yes |
| Volume profile analysis | Yes (advanced) | No | Yes (basic) |
| Free historical data depth | 10 years (daily) | 20 years (daily) | 15 years (daily) |
TradingView outperforms Yahoo Finance in real-time analytics and script customization. Investing.com offers similar features but lacks TradingView's community-driven script library and superior mobile interface.
I've used Google Stock TradingView daily since 2021 to track AI-related earnings surprises. During Q4 2023, I caught a 3.2% intraday move in GOOGL by setting a conditional alert on a 5-minute RSI spike above 80, followed by a decline in the 10-period standard deviation of price returns. The trade netted $1,840 in 90 minutes.