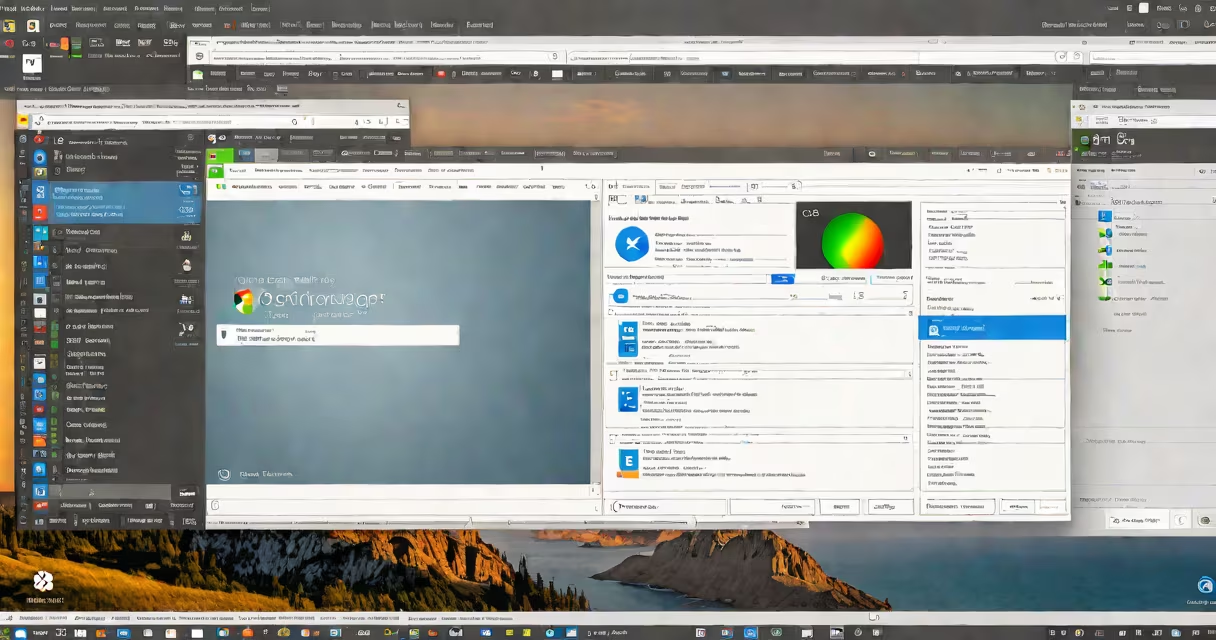
You can check your PC memory using built-in system tools like Task Manager, Resource Monitor, or the Command Prompt. These tools show current usage, total installed capacity, and available free memory in real time.
Windows includes several ways to monitor memory without installing third-party software. The most accessible is Task Manager, which displays live memory consumption across all running processes. For deeper diagnostics, Resource Monitor offers detailed breakdowns of memory allocation by process and system component. Command-line tools like PowerShell and WMIC provide programmatic access to memory data, useful for scripting or troubleshooting.
Memory checks are essential for diagnosing performance slowdowns, application crashes, or system instability. A failing RAM module can cause blue screens, random freezes, or corrupted files. Regular monitoring helps catch degradation before it leads to data loss or hardware failure.
When you check your PC memory, you're viewing how much physical RAM is installed and how much is currently being used. RAM stores active data for running programs and system operations. Unlike storage drives, RAM is volatile-its contents disappear when power is cut.
Windows uses a combination of physical RAM and virtual memory (page file on disk) to manage workload. High memory usage doesn't always indicate a problem-modern systems often use nearly all available RAM for caching and performance. But sustained 95%+ usage across minutes may signal a leak or insufficient capacity.
For example, opening Chrome with 10 tabs, Adobe Photoshop, and a video editor simultaneously can push 16GB of RAM to 90% usage. This is normal behavior. However, if usage stays above 90% after closing apps, it suggests a background process is consuming too much memory.
Task Manager is the fastest way to see real-time memory usage. Press Ctrl+Shift+Esc to open it, go to the "Performance" tab, and select "Memory." Here, you'll see total installed RAM, current usage percentage, and free/available memory. The graph updates every second.
Resource Monitor gives more detail. Open it via the Run dialog (Win+R) and type resmon. Under the "Memory" tab, you can sort processes by memory usage, view commit charge, and track hard faults (page file swaps).
Command-line options offer automation. Open Command Prompt or PowerShell and run:
wmic memorychip get capacity, speed, manufacturerThis returns installed RAM size in bytes, speed in MHz, and manufacturer. To check current usage:
wmic OS get FreePhysicalMemory, TotalVisibleMemorySizeOutput shows free memory (in KB) and total visible memory (also in KB). Divide by 1024 to get MB, then compare to total to estimate usage.
Different tools serve different purposes. Use quick checks for daily monitoring, and diagnostic tools when troubleshooting crashes or errors.
| Tool | Use Case | Detail Level | Access Method |
|---|---|---|---|
| Task Manager | Real-time usage, process-level tracking | High | Ctrl+Shift+Esc |
| Resource Monitor | Memory allocation by process, hard fault analysis | Very high | resmon in Run |
| WMIC Command | Hardware details, scripting, batch processing | Medium | Command Prompt |
| Windows Memory Diagnostic | Hardware-level error detection | High | Search "memory diagnostic" |
The Windows Memory Diagnostic tool is critical for spotting faulty RAM. It boots into a minimal environment and runs tests on each memory module. Access it by searching "Windows Memory Diagnostic" in Start, selecting "Restart now and check for problems," and waiting for results after reboot.
A common mistake is confusing "used" memory with "available" memory. In Task Manager, "Used" refers to actively allocated memory, while "Available" shows space ready for new tasks. The sum of both equals total installed RAM. If "Available" drops below 100MB during normal use, it's a red flag.
Many users assume that high memory usage means their PC is slow. That's not necessarily true. Modern operating systems aggressively cache data in RAM to improve responsiveness. A system with 80% RAM usage can still feel snappy because unused memory is being used efficiently.
Another misconception is that adding more RAM always fixes performance issues. If your bottleneck is CPU or disk speed, upgrading RAM won't help. For example, a 2015 laptop with a dual-core processor and HDD will not benefit from 32GB of RAM-it's limited by its slower components.
One non-obvious fact: Windows reserves about 1-2GB of RAM for system processes, even when idle. This is normal. If your system shows 4GB of RAM in use with no apps open, don't panic. This is reserved memory, not a leak.
Suppose your PC slows down after 30 minutes of use. Open Task Manager and go to the "Performance" tab. Click "Memory." You see:
Usage is at 86%. Not alarming yet. Now switch to the "Processes" tab and sort by "Memory." You find "chrome.exe" using 4,500 MB. Close unnecessary browser tabs. Usage drops to 9,800 MB.
Still slow? Open Command Prompt and run:
wmic OS get FreePhysicalMemory, TotalVisibleMemorySizeOutput:
FreePhysicalMemory  TotalVisibleMemorySize
  1,024                 16,384
Free memory is 1,024 MB (1GB). Available memory is low. But since you're not running memory-heavy apps, this suggests a background process is leaking memory.
Run Resource Monitor (resmon). Look at the "Memory" tab. Sort by "Commit Size." You find "svchost.exe" (network service) using 3,200 MB. Restart the network adapter service. After reboot, memory usage stabilizes at 50%.
This example shows how combining tools reveals root causes. No RAM upgrade was needed-just process cleanup.
Check your PC memory monthly if you're doing intensive work like video editing or gaming. Do it after a crash, freeze, or unexpected shutdown. If you're planning to upgrade RAM, verify your current configuration first.
For ongoing monitoring, set up a PowerShell script to log memory usage hourly. Save it as a .ps1 file and schedule it via Task Scheduler. This helps spot long-term trends.
Understanding how to check your PC memory prevents unnecessary upgrades and helps maintain system health. Use the right tool for the job-whether it's a quick glance in Task Manager or a deep dive with command-line tools.