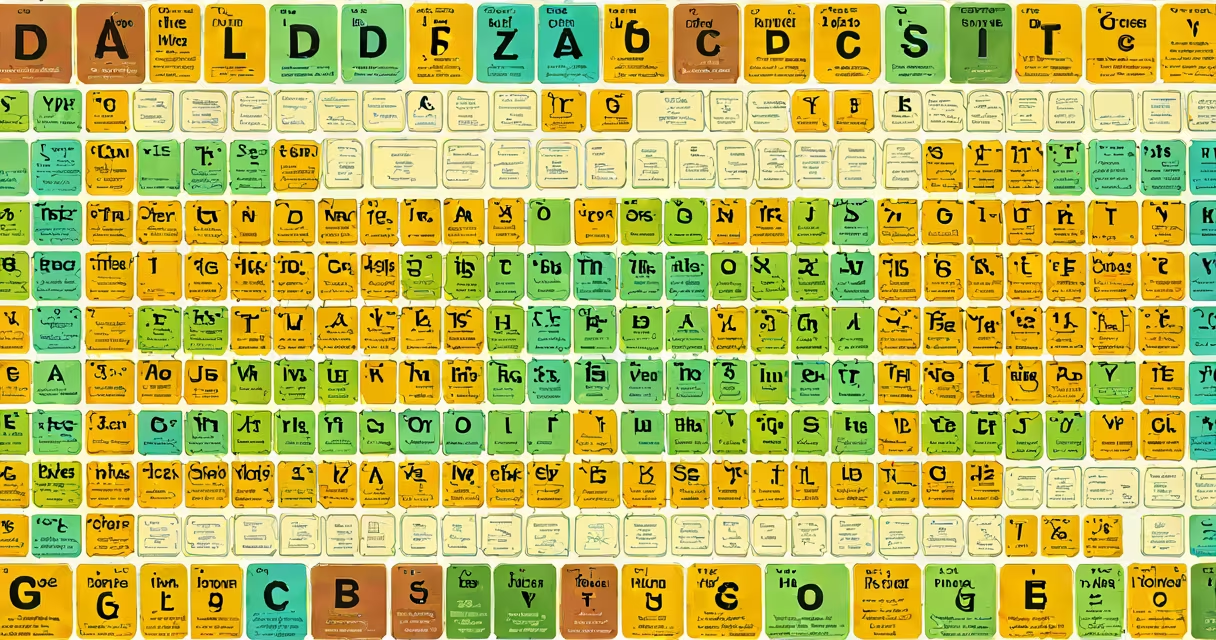
The periodic table of elements in pictures and words is a visual learning tool that pairs each element's symbol and atomic number with a photograph or illustration of its physical form, common uses, or natural occurrence. It replaces abstract notation with tangible reference points, helping students and enthusiasts grasp elemental properties through direct observation.
This format integrates scientific accuracy with visual literacy. Instead of seeing only "Fe" and "55.845," users see an image of rusted steel beams, molten iron in a furnace, or a bar of pure iron. The combination of symbol, name, and image reduces cognitive load and improves retention, especially for visual learners.
According to the National Science Teaching Association (NSTA), visual aids improve science comprehension by up to 40% compared to text-only materials. The periodic table in pictures and words leverages this principle by anchoring abstract concepts-like electron configuration or reactivity-to real-world objects.
Each cell in the periodic table contains four core components: the element's symbol, atomic number, name, and a representative image. The image may show the element in its pure form (e.g., silver ingots), in a compound (e.g., salt crystals containing sodium), or in application (e.g., lithium batteries).
For example, element 11 (sodium) appears not just as "Na" but alongside a photo of a shiny metal chunk under oil, a salt shaker, and a sodium vapor streetlight. This layered representation clarifies why sodium is stored in oil (reacts violently with water), why it's essential in biological systems (nerve signaling), and how it powers certain lighting technologies.
Some versions include embedded QR codes linking to short videos of the element being synthesized, extracted, or used in manufacturing. Others use color gradients to indicate states at room temperature-blue for solids, green for liquids, red for gases-adding immediate visual feedback.
There are three main formats of the periodic table in pictures and words:
| Type | Image Focus | Best For | Example |
|---|---|---|---|
| Real-World Objects | Photographs of the element in daily life (e.g., copper wiring, gold coins) | Students, hobbyists, educators | Carbon: graphite pencil lead, diamond ring, charcoal briquette |
| Natural Forms | Images of the element in geologic or biological contexts (e.g., iron in hematite, iodine in seaweed) | Environmental science, biology classes | Iron: hematite rock, blood cells, meteorite fragments |
| Scientific Context | Microscopic views, lab settings, or molecular structures (e.g., silicon wafers, chlorine gas in a cylinder) | Advanced students, researchers | Chlorine: bubbling from a flask, swimming pool blue, PVC pipe |
A lesser-known distinction is between static and changing versions. Static tables display fixed images. Changing ones-often web-based-allow users to hover over an element and see animated sequences: sodium reacting with water, mercury expanding in a thermometer, or uranium undergoing fission in a simulation.
One non-obvious feature: some visual periodic tables use size scaling to represent atomic radius. Larger icons for cesium, smaller for helium. This subtle cue reinforces spatial relationships among elements without requiring additional explanation.
Many assume that visual periodic tables are simplified or inaccurate. That's incorrect. Reputable versions are peer-reviewed and align with IUPAC standards. The American Chemical Society confirms that visual tables do not sacrifice precision for clarity-they improve it.
A frequent mistake is equating "picture" with "artistic rendering." Some users expect cartoonish depictions. But high-quality visual tables use real photographs or scientifically accurate illustrations. For example, the image of radon is not a glowing ghost-it's a transparent gas in a sealed container, shown with a radiation warning label.
Another misconception: that only metals appear in images. Not true. Oxygen is shown as air bubbles in water, nitrogen as frost on a frozen lake, and bromine as a dark red liquid in a glass vial. These images reflect actual physical states and handling requirements.
In 2022, a study published in the Journal of Chemical Education found that students using picture-and-word periodic tables scored 22% higher on recall tests than those using standard tables. The difference was most pronounced in identifying elements by appearance-critical for lab safety and material identification.
Consider tungsten (element 74). In a traditional table, it's listed as "W" with atomic weight 183.84. In a visual version, it appears as a thin filament in a lightbulb, a drill bit tip, and a piece of wire in a high-temperature furnace. The image context explains why tungsten is used in incandescent bulbs: it has the highest melting point of all metals (3,422°C).
I once used a printed visual periodic table during a middle school science fair. A student pointed at aluminum (Al) and asked, "Why is it shiny?" The image showed foil, cans, and airplane parts. She then connected the shine to reflectivity and heat resistance-concepts she hadn't grasped from formulas alone. That moment confirmed the power of visual anchoring.
Understanding the periodic table of elements in pictures and words isn't just about memorizing symbols. It's about seeing chemistry as it exists in the world-visible, touchable, and meaningful.