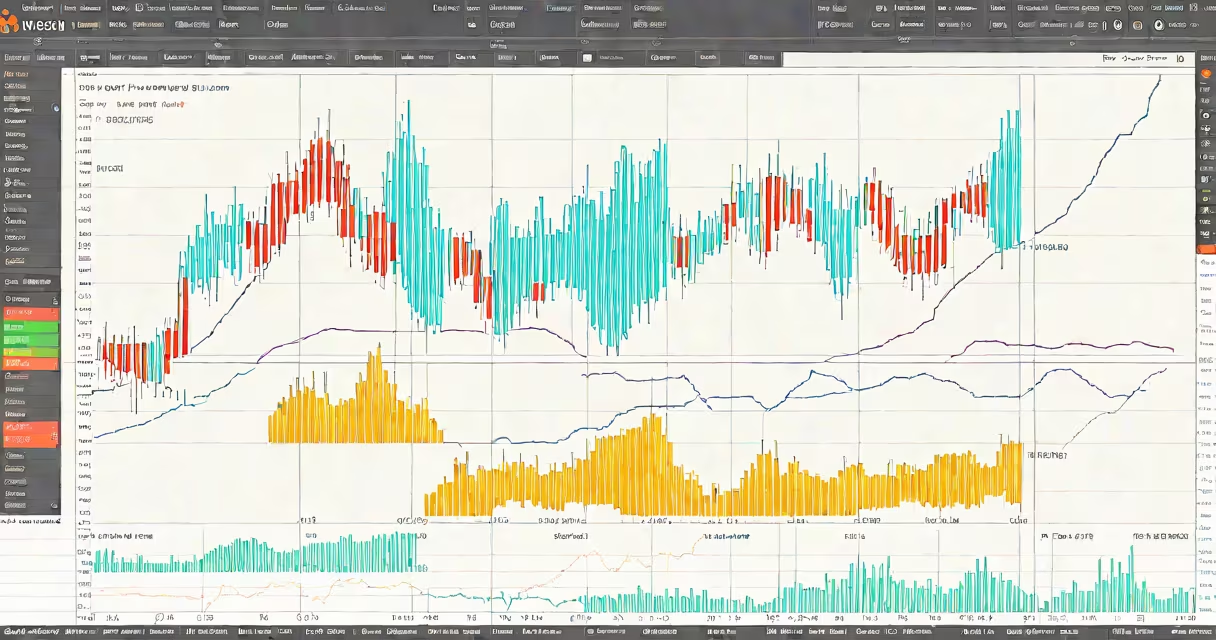
The tradingview rsi chart is a technical analysis tool that plots the Relative Strength Index (RSI) on a price chart using TradingView's platform. It measures the speed and change of price movements to identify overbought or oversold conditions in financial instruments such as stocks, forex pairs, or cryptocurrencies.
RSI values range from 0 to 100. A reading above 70 typically signals overbought territory, suggesting a potential price reversal downward. A reading below 30 indicates oversold conditions, which may precede a bounce upward. These thresholds are standard but not absolute-some traders adjust them based on asset volatility.
TradingView integrates RSI into its customizable interface. Users can apply the indicator to any timeframe-daily, hourly, or even tick-level data-and overlay it on price charts. The platform supports multiple RSI settings, including period length (default 14), smoothing methods, and color customization.
RSI calculates the ratio of average gains to average losses over a specified period. The default period is 14 days, though traders often test 7, 9, or 21 periods depending on strategy. The formula adjusts for recent price changes, giving more weight to newer data.
For example, if a stock rises 5% over five days and falls 3% over the next five, the RSI will reflect stronger upward momentum. If the declines accelerate while prices remain flat, RSI drops toward 30, signaling potential weakness.
Traders use RSI not as a standalone signal but as confirmation. A bullish breakout on a daily chart becomes more credible if RSI is rising above 50 and moving away from oversold levels. Conversely, a bearish move gains strength if RSI confirms downward momentum by breaking below 50.
While the core RSI calculation remains consistent, users can modify its appearance and behavior in TradingView:
| Setting | Description | Common Use Case |
|---|---|---|
| Period Length | Number of bars used in RSI calculation | 7 for scalping; 14 for swing trades; 21 for long-term trends |
| Smoothing Method | Simple, exponential, or linear weighting | Exponential reduces lag; useful in fast-moving markets |
| Threshold Levels | Custom overbought/oversold zones | Adjusting to 75/25 for high-volatility assets like crypto |
Advanced users create custom scripts using Pine Script, TradingView's programming language. For instance, a trader might code an RSI divergence alert that triggers when price makes a higher high but RSI fails to match it-indicating weakening momentum.
RSI appears on nearly every charting platform because it's accessible and widely validated. According to Investopedia, RSI was developed by J. Welles Wilder Jr. in 1978 and remains one of the most cited indicators in technical analysis.
Traders use the tradingview rsi chart to time entries and exits. A common strategy involves buying when RSI dips below 30 and begins rising, especially if the price is near a support level. Selling occurs when RSI exceeds 70 and starts declining, particularly if volume increases.
For example, during January 2023, Bitcoin dropped from $24,000 to $16,000. On the daily chart, RSI fell below 30 on January 12. Over the next 14 days, RSI rose steadily while price consolidated. By February 1, RSI hit 55 and broke above 50. A trader who bought then saw a 40% gain within three weeks as BTC climbed back to $22,000.
Many assume RSI predicts direction outright. This is incorrect. RSI shows momentum, not trend. A strong uptrend can sustain RSI above 70 for extended periods-especially in bull markets like 2020-2021 for tech stocks.
Another error is treating RSI as a standalone buy/sell signal. In reality, it works best when combined with other tools. For instance, a bullish RSI crossover above 50 gains credibility if the price is above a 200-day moving average and volume is increasing.
A lesser-known fact: RSI can be applied to non-price data. Some traders analyze RSI on order flow metrics, social media sentiment scores, or even macroeconomic indicators like unemployment rates. While less common, this expands RSI beyond traditional market timing.
On March 15, 2024, Apple (AAPL) traded at $185. The 14-period RSI on the 1-hour chart stood at 28. Price had declined 8% over the prior 48 hours. Volume spiked on the last candle, confirming selling pressure.
Over the next 12 hours, RSI climbed from 28 to 52. Price stabilized around $182. A trader monitoring this pattern entered a long position at $182.50. Within 48 hours, AAPL rebounded to $190, and RSI reached 68. The trade yielded a 4.5% return in under two days.
This scenario illustrates how RSI acts as a momentum filter. Without it, the trader might have missed the reversal signal amid noise.
When using the tradingview rsi chart, always verify signals with price action and volume. RSI alone cannot account for news events, earnings reports, or sudden shifts in market sentiment.
Understanding the tradingview rsi chart improves decision-making in volatile environments. It's not a crystal ball-but when paired with context, it reveals patterns invisible to the naked eye.