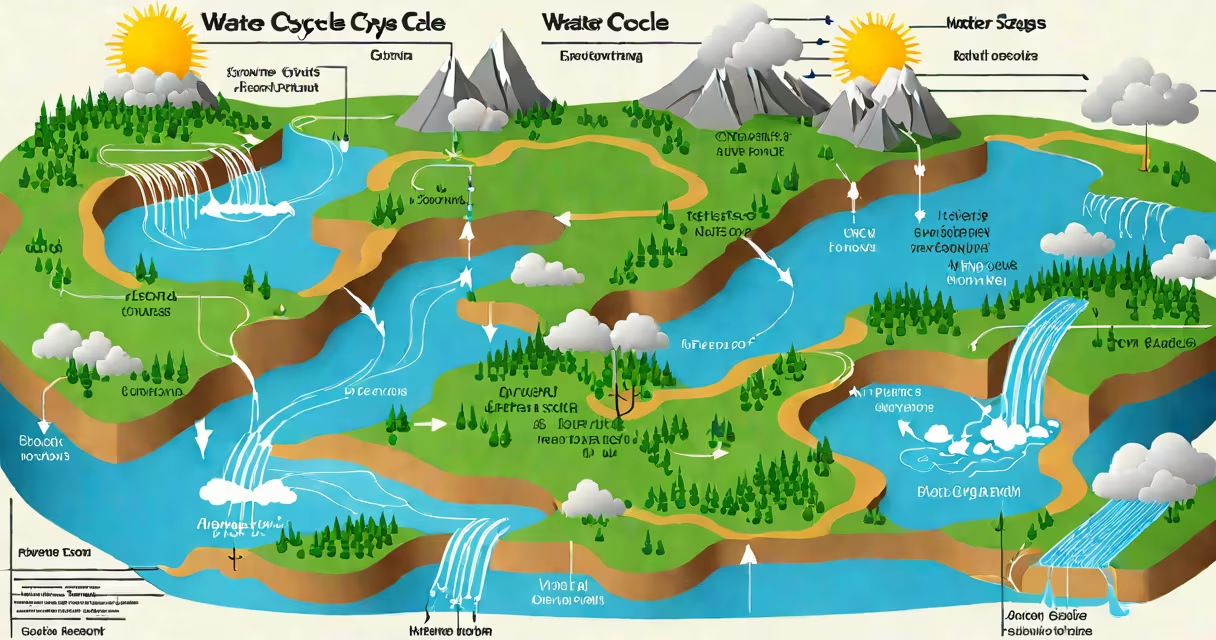
A water cycle stages diagram illustrates the continuous movement of water on Earth through evaporation, condensation, precipitation, and collection-key processes in the hydrological cycle. These stages show how water transitions between liquid, vapor, and ice forms across ecosystems.
The water cycle begins with evaporation, where solar energy heats surface water in oceans, lakes, and rivers, turning it into water vapor. This vapor rises into the atmosphere. According to the U.S. Geological Survey, approximately 90% of atmospheric moisture comes from ocean evaporation.
As vapor ascends, it cools and undergoes condensation-forming clouds. Tiny water droplets or ice crystals cluster around dust particles, creating visible cloud formations. NASA notes that condensation requires both cooling and nuclei for water molecules to bond.
When droplets grow too large to remain suspended, they fall as precipitation-rain, snow, sleet, or hail. The form depends on air temperature. For example, rain falls below 0°C only if it passes through warmer layers.
After precipitation, water moves via runoff, infiltration, and transpiration. Runoff flows over land into rivers and eventually returns to oceans. Infiltration allows water to seep into soil and recharge groundwater. Transpiration occurs when plants release water vapor through their leaves-a process that contributes up to 10% of atmospheric moisture in forested regions.
| Stage | Process | Energy Source | Example |
|---|---|---|---|
| Evaporation | Surface water turns to vapor | Solar radiation | Ocean surface heating under sunlight |
| Condensation | Vapor cools and forms clouds | Atmospheric cooling | Fog forming at night over a lake |
| Precipitation | Water falls from clouds | Gravity and cloud dynamics | Thunderstorm dumping 2 inches of rain in 30 minutes |
| Collection & Runoff | Water gathers in bodies or flows over land | Gravity | River flowing into a delta after heavy rain |
Many diagrams simplify the cycle into four core stages. However, advanced models include sub-processes like sublimation (ice to vapor) and deposition (vapor to ice). A common mistake is assuming all precipitation reaches the ground-up to 30% evaporates mid-air during dry thunderstorms, according to NOAA.
These diagrams are essential in environmental science education. They appear in textbooks, classroom posters, and climate models. A well-labeled water cycle stages diagram helps students visualize how human activity affects water availability. For instance, deforestation reduces transpiration, altering local rainfall patterns.
One non-obvious fact: the water cycle is not linear. Water doesn't move in a single loop. Some drops return to the atmosphere within hours; others may take centuries to resurface in aquifers. The average water molecule spends about 3,000 years in the ocean before evaporating.
A real-world example: in 2017, Hurricane Harvey dumped over 60 inches of rain on Houston. The storm's moisture originated from the Gulf of Mexico. A water cycle stages diagram would trace that moisture from evaporation over warm waters, condensation in high-altitude clouds, then intense precipitation as the storm moved inland.
Some diagrams omit labels to test understanding. A water cycle diagram without labels challenges viewers to identify each stage based on context. This format is useful in assessments and interactive learning tools.
For educators and students, drawing a diagram of the water cycle reinforces memory. Start with a sun above an ocean, draw rising wavy lines to represent vapor, add a cloud with downward arrows for rain, then show rivers returning to the sea. Include small trees to represent transpiration.
Understanding the water cycle is foundational in biology water cycle lessons. It explains nutrient transport, habitat maintenance, and climate regulation. The cycle also informs flood prediction, drought modeling, and agricultural planning.
When studying the water cycle stages diagram, focus on energy flow-not just water movement. Solar energy drives evaporation. Gravity pulls precipitation down. Heat transfer enables phase changes. These physical principles govern every stage.
Water cycle stages diagrams are not static-they reflect changing balance. Human actions such as urbanization, irrigation, and dam construction disrupt natural flow. Understanding these diagrams helps assess environmental impact and design sustainable water management strategies.