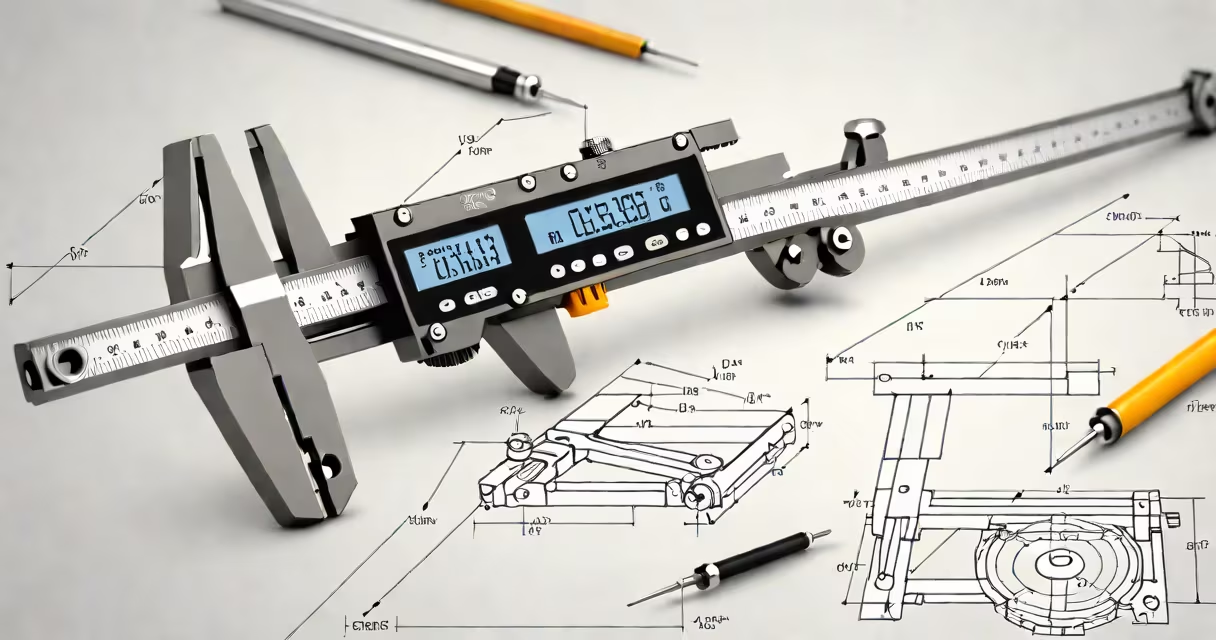
Precision describes how close repeated measurements are to each other under the same conditions, regardless of whether they match the true value. High precision means low variability in results, even if those results are consistently off. This concept is foundational in experimental science, engineering, and quality control.
When you measure the same object multiple times using the same tool and method, precision reflects how tightly those values cluster together. For example, if you weigh a 100-gram standard weight five times and get 99.8 g, 99.7 g, 100.1 g, 99.9 g, and 100.0 g, the measurements show high precision because they're tightly grouped around 99.9 g. But if the scale is miscalibrated, they may lack accuracy-meaning they're precise but not correct.
High precision reduces uncertainty in data. In manufacturing, a machine that cuts metal parts to within ±0.01 mm repeatedly demonstrates high precision. In physics labs, instruments like spectrometers report results with stated precision levels-e.g., ±0.002 nm-to indicate how reproducible readings are. Precision is not about correctness; it's about consistency.
Precision depends on instrument resolution, environmental stability, and operator technique. A digital scale with a 0.1 g display shows readings in increments of 0.1 g, but its actual precision may be lower due to internal noise or drift. Repeated tests reveal whether the device produces consistent outputs.
Consider a stopwatch used to time a 100-meter dash. If three runners are timed as 10.43 s, 10.45 s, and 10.42 s, the precision is high-values differ by less than 0.03 seconds. But if the same stopwatches record 10.43 s, 10.67 s, and 10.21 s, the precision is poor. The variation suggests inconsistent timing, possibly due to human reaction delay or device malfunction.
Statistically, precision is often quantified using standard deviation or variance. A low standard deviation means values cluster tightly-high precision. A high standard deviation indicates spread-low precision. These metrics allow comparison across devices, methods, or experiments.
Precision varies by context. In metrology, it's categorized by measurement system and required tolerance. Here's how different fields define and apply precision:
| Type | Definition | Use Case | Example |
|---|---|---|---|
| Repeatability | Consistency under identical conditions by the same person | Laboratory testing | Measuring pH five times with the same electrode and solution |
| Reproducibility | Consistency across different operators or locations | Quality assurance across factories | Two teams in different countries test the same batch of pharmaceuticals |
| Resolution | Smallest detectable change in a measurement | Instrument design | A micrometer with 0.001 mm markings |
Repeatability and reproducibility are critical in clinical trials. The U.S. FDA requires that diagnostic tools demonstrate both high repeatability and reproducibility to ensure patient safety. A blood glucose meter that gives readings of 98 mg/dL, 97 mg/dL, and 99 mg/dL over three tests shows good repeatability. If another lab gets similar results, reproducibility is confirmed.
Resolution is not the same as precision. A thermometer showing 36.5°C doesn't mean it's precise-it could be reading the same value every time but still be off by 1°C. True precision requires variation analysis across multiple trials.
Precision is frequently mistaken for accuracy. Accuracy refers to how close a measurement is to the true value. A dart player who hits near the bullseye scores high accuracy. One who hits the same spot repeatedly, even if far from the center, shows high precision. Both are needed for reliable results.
Another misconception is that high precision implies high reliability. A sensor that consistently reports 25.0°C in a room known to be 22.0°C is precise but unreliable. The error is systematic, not random. This distinction is important in climate monitoring-satellites must have both high precision and calibrated accuracy to track long-term temperature trends.
Even experts sometimes confuse precision with significant figures. Significant figures represent the precision of a reported number, but they don't guarantee actual measurement precision. Reporting a result as 3.14159 implies six digits of precision, but if the measuring device only resolves to 0.01, the extra digits are misleading.
As a researcher, I once saw a team publish results with five decimal places based on a ruler marked in millimeters. The data looked detailed, but the precision was physically impossible. The lesson: precision must reflect real capability, not just digit count.
In aerospace, engine tolerances are measured in microns. A turbine blade must fit within ±2 μm of design specs. Even small deviations affect fuel efficiency and safety. High precision ensures components function predictably across thousands of cycles.
Medical imaging relies on precision. MRI machines must produce consistent images across scans. A tumor's size is tracked over time-small changes matter. If the scanner's precision is poor, a real growth might be missed or falsely detected.
For quality control, precision determines defect rates. A factory producing screws specifies a diameter of 5.00 mm ±0.02 mm. If the production process has high precision, most screws fall within tolerance. Low precision leads to waste and recalls.
According to NIST (National Institute of Standards and Technology), "Precision is essential for comparing results across experiments and ensuring that findings are replicable." Their guidelines emphasize that reporting precision improves transparency and trust in data.
Similarly, ISO 5725 defines precision as comprising repeatability and reproducibility, forming the basis for inter-laboratory comparisons. These standards prevent false conclusions from noisy or inconsistent data.
Precision is the degree to which repeated measurements under unchanged conditions show the same results. It reflects consistency, not correctness. A measurement can be highly precise yet inaccurate, or accurate but imprecise. Understanding this difference prevents misinterpretation of data in science, industry, and daily life.