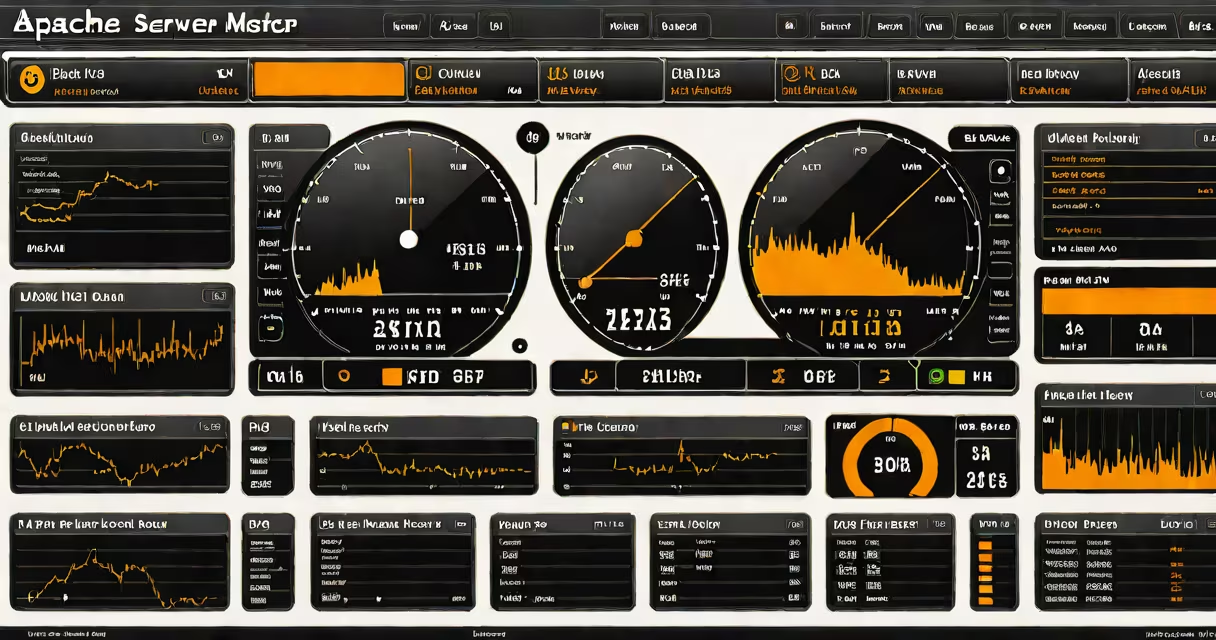
An Apache server monitor is a tool or service that continuously checks the availability, performance, and health of an Apache HTTP Server instance. It detects failures, measures response times, logs errors, and alerts administrators when issues arise.
Apache HTTP Server powers over 40% of websites globally, according to Netcraft's 2023 Web Server Survey. Its widespread use makes consistent monitoring essential. Without a dedicated monitor, downtime can go unnoticed for hours, leading to lost traffic and revenue.
Monitoring tools track metrics such as HTTP status codes (e.g., 500 Internal Server Error), response latency, CPU and memory usage, and disk I/O. They trigger alerts via email, SMS, or integrations with platforms like Slack or PagerDuty when thresholds are breached.
Apache server monitors operate through periodic checks-typically every 30 to 60 seconds-using HTTP requests to the server's root endpoint or specific test URLs. These probes simulate real user behavior and measure how quickly the server responds.
For example, a monitor may send a GET request to https://yoursite.com/health-check. If the server returns a 200 OK within 2 seconds, the check passes. If it returns a 503 Service Unavailable or takes longer than 3 seconds, the monitor flags it as degraded or failed.
Advanced monitors also analyze server logs in real time. Tools like Logstash or Fluentd ingest Apache access and error logs, then apply rules to detect patterns-such as a spike in 404 errors indicating broken links-or a sudden rise in 5xx errors signaling backend crashes.
Monitors fall into two categories: external and internal. External monitors run from remote locations (e.g., cloud-based services like UptimeRobot or Datadog). Internal monitors run on the same machine or network as the Apache server.
| Type | Pros | Cons |
|---|---|---|
| External (cloud) | Tests from multiple global locations; immune to local outages | Higher cost; less control over configuration |
| Internal (local) | Low cost; high precision; integrates with local scripts | Can't detect network-wide issues; vulnerable to server failure |
Some monitors include synthetic transactions-automated browser tests that simulate form submissions or login flows. These catch deeper issues beyond basic HTTP reachability, such as JavaScript errors or database connection failures.
A common mistake is assuming that a 200 response means everything is working. A server may return 200 OK while serving cached content or failing to update session data. Effective monitors validate both status and content integrity. For example, checking that a page includes expected text like "Welcome, John" confirms functional correctness-not just connectivity.
Web operations teams use Apache server monitors to maintain SLAs (Service Level Agreements). A typical e-commerce site might require 99.9% uptime. Monitors ensure compliance by logging every incident and providing reports for audits.
During peak traffic events-like Black Friday sales-monitors help identify bottlenecks. One team I worked with noticed a 5-second average response time during a flash sale. The monitor flagged slow queries in the application layer, which led to optimizing database indexes and reducing load time by 70%.
Security teams rely on monitors to detect attacks. A sudden surge in 404 errors across thousands of IPs often indicates a bot scanning for vulnerabilities. Tools like Fail2Ban can auto-block IPs based on monitor-triggered rules.
Apache server monitor is often mistaken for Apache status modules like mod_status. While mod_status provides real-time data on active connections, request rates, and memory usage, it doesn't send alerts or track historical performance. It's a diagnostic tool, not a monitoring system.
Another confusion arises between monitoring and logging. Logging records what happened-such as a 500 error in the error.log file. Monitoring interprets those logs and acts on them. A log shows a crash occurred; a monitor tells you when, how long it lasted, and who was affected.
A monitor cannot fix problems-it only detects them. Fixing requires separate processes: automated restart scripts, load balancer failover, or manual intervention. Think of it as a security camera: it sees the break-in but doesn't stop it.
Set up a multi-layered monitoring strategy. Use at least one external monitor and one internal agent. Configure the external monitor to ping your site from three global regions. Set alerts for any failure lasting more than 2 minutes.
Here's a real example: a small SaaS company runs Apache on Ubuntu 22.04 with PHP-FPM. They installed the free version of UptimeRobot and added a check for https://app.example.com/heartbeat. The check runs every 1 minute from New York, London, and Tokyo.
When the server crashed due to a misconfigured .htaccess file, the monitor detected the 500 error within 60 seconds. An alert went to the on-call engineer via Slack. The team restored service in 12 minutes using a backup of the previous config.
They later added a local check using Nagios. This monitored Apache's process ID and memory usage. When memory spiked above 85%, Nagios triggered a warning-even before the server became unresponsive.
Both systems together caught issues faster than either could alone. The combination reduced average downtime from 27 minutes to under 5 minutes.
For deeper visibility, integrate your monitor with a dashboard tool like Grafana. Pull data from Apache's mod_status and log files, then visualize trends over time. Track daily request volume, error spikes, and top referrers to spot anomalies early.
Always test your monitor's alerting chain. Simulate a failure and verify that notifications arrive within 90 seconds. Use tools like curl or Postman to manually trigger a 500 error and confirm the monitor reacts correctly.
Understanding how a network server operates clarifies why monitoring matters. The server handles incoming requests, serves files, manages sessions, and communicates with databases. Any failure in this chain disrupts users. Monitoring is the only way to see the whole picture.
Apache server monitor is not optional for production environments. It's a core component of infrastructure resilience. Without it, you're operating blind. With it, you gain visibility, accountability, and faster recovery.