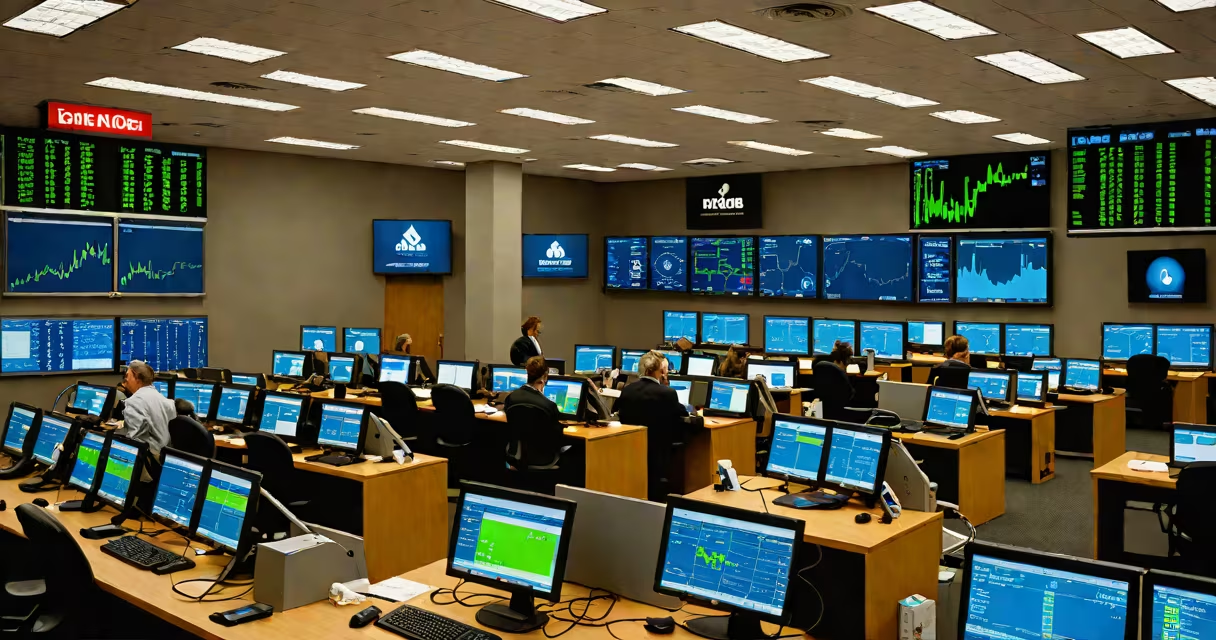
Henry Hub natural gas futures are standardized derivative contracts traded on the CME Group that settle based on the price of natural gas delivered at the Henry Hub in Louisiana-a major U.S. natural gas pipeline junction. These contracts serve as the benchmark for natural gas pricing across North America and influence energy costs for consumers, utilities, and industrial users.
The Henry Hub is the central node in the U.S. natural gas transportation network. Located in Erath, Louisiana, it connects over 100 pipelines and handles roughly 15% of U.S. natural gas supply. Because of its connectivity and regulatory oversight, the Henry Hub became the reference point for natural gas pricing in the 1990s. The CME Group launched standardized futures contracts tied to this location in 1997, creating a transparent, liquid market for hedging and speculation.
Each contract represents 10,000 million British thermal units (MMBtu) of natural gas. Traders buy and sell these contracts to lock in prices for future delivery, typically within 12 months. Settlement occurs via cash rather than physical delivery, meaning traders profit or lose based on price changes between contract entry and expiration. This structure allows broad participation-from energy companies to hedge funds and individual investors.
When a power plant operator expects to need natural gas for winter heating, they may purchase Henry Hub futures to fix their fuel cost. If the market price rises before delivery, the gain on the futures contract offsets the higher purchase price. Conversely, a natural gas producer might sell futures to protect against falling prices.
Trading occurs on the CME Globex electronic platform during U.S. business hours. Daily volume averages 300,000 contracts, making it one of the most liquid energy markets globally. Prices move rapidly in response to weather forecasts, storage reports, and geopolitical events. For example, a cold snap in January 2023 caused prices to spike 22% in two days due to increased demand and low storage levels.
Futures prices are calculated using a continuous forward curve. The nearest-month contract sets the current spot price, while longer-dated contracts reflect expected future supply and demand. A steep upward curve indicates expectations of rising prices-often due to anticipated shortages. A backwardated curve (where near-term prices exceed distant ones) signals tight supply or high demand in the near term.
Henry Hub natural gas futures are available in monthly expirations, with contracts listed for up to 24 months out. The standard contract size is 10,000 MMBtu, and each tick (minimum price movement) is $0.001 per MMBtu-equivalent to $10 per contract. Minimum margin requirements are set by the CME and vary by account type and risk profile.
| Contract Type | Size | Settlement Method | Trading Platform |
|---|---|---|---|
| Front-month | 10,000 MMBtu | Cash-settled | CME Globex |
| Back-month | 10,000 MMBtu | Cash-settled | CME Globex |
| Spread options | 10,000 MMBtu per leg | Cash-settled | CME Globex |
Traders often use calendar spreads-buying one month's contract and selling another-to bet on price differentials. For instance, in late 2022, a trader bought December 2022 contracts and sold June 2023 contracts, profiting $1.20 per MMBtu when winter demand pushed December prices higher than expected.
Henry Hub futures are not physical gas. They do not deliver actual natural gas to buyers. The settlement is purely financial. This is a frequent misunderstanding among retail investors who assume they're buying a commodity they'll receive. In reality, they're betting on price direction.
Another common error is equating Henry Hub with global gas prices. While it's the benchmark for North America, European gas trades on the TTF (Title Transfer Facility) in the Netherlands, and Asian prices follow Japan's JKM index. These benchmarks differ -especially during supply disruptions. In 2022, Henry Hub averaged $6.50/MMBtu, while TTF peaked above €40/MWh, reflecting regional supply dynamics.
A lesser-known fact: Henry Hub futures are priced in U.S. dollars per MMBtu, but traders convert to other units for comparison. For example, 1 MMBtu equals approximately 29.3 kWh of electricity. A $5.00/MMBtu price translates to roughly $0.17 per kWh-useful for comparing gas-fired power generation costs to renewables.
In 2021, I monitored Henry Hub futures during Texas's winter storm. As temperatures dropped below freezing, grid operators scrambled to secure fuel. Natural gas prices surged from $3.50 to $12.00/MMBtu in 48 hours. I tracked the move through CME data, observing how futures volumes spiked as hedge funds adjusted positions. The event highlighted how quickly weather and infrastructure stress can distort pricing-even in a well-regulated market.
Energy companies use these contracts to manage risk. Duke Energy, for example, locks in 60% of its annual gas needs via Henry Hub futures to stabilize utility rates. Similarly, airlines like Delta use natural gas derivatives to hedge jet fuel costs, since natural gas is used in refining kerosene.
For investors, Henry Hub futures offer exposure to energy cycles without owning physical assets. During the 2020 pandemic, prices fell below $1.50/MMBtu due to reduced industrial demand. Traders who shorted contracts profited as prices rebounded to $4.00/MMBtu by Q3 2021.
Henry Hub natural gas futures remain central to North American energy economics. Their transparency, liquidity, and widespread adoption make them essential tools for managing risk, forecasting prices, and understanding energy flows across industries.